Page 137 - Statistics for Dummies
P. 137

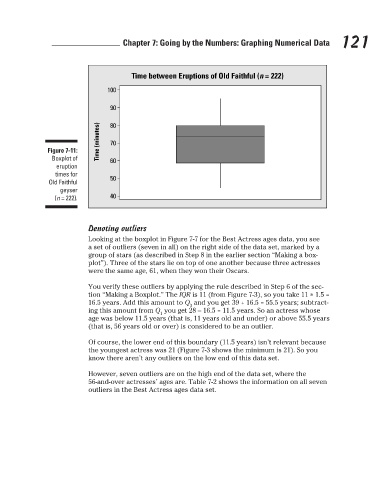
Time between Eruptions of Old Faithful (n = 222)
                                                          90
                                                          80
                                                          70
                                        Figure 7-11:
                                         Boxplot of
                                                          60
                                           eruption
                                          times for
                                                          50
                                         Old Faithful
                                             geyser
                                                          40
                                          (n = 222).
                                                       Time (minutes)  100   Chapter 7: Going by the Numbers: Graphing Numerical Data  121
                                                    Denoting outliers
                                                    Looking at the boxplot in Figure 7-7 for the Best Actress ages data, you see
                                                    a set of outliers (seven in all) on the right side of the data set, marked by a
                                                    group of stars (as described in Step 8 in the earlier section “Making a box-
                                                    plot”). Three of the stars lie on top of one another because three actresses
                                                    were the same age, 61, when they won their Oscars.
                                                    You verify these outliers by applying the rule described in Step 6 of the sec-
                                                    tion “Making a Boxplot.” The IQR is 11 (from Figure 7-3), so you take 11 ∗ 1.5 =
                                                    16.5 years. Add this amount to Q  and you get 39 + 16.5 = 55.5 years; subtract-
                                                                                3
                                                    ing this amount from Q  you get 28 – 16.5 = 11.5 years. So an actress whose
                                                                        1
                                                    age was below 11.5 years (that is, 11 years old and under) or above 55.5 years
                                                    (that is, 56 years old or over) is considered to be an outlier.
                                                    Of course, the lower end of this boundary (11.5 years) isn’t relevant because
                                                    the youngest actress was 21 (Figure 7-3 shows the minimum is 21). So you
                                                    know there aren’t any outliers on the low end of this data set.
                                                    However, seven outliers are on the high end of the data set, where the
                                                    56-and-over actresses’ ages are. Table 7-2 shows the information on all seven
                                                    outliers in the Best Actress ages data set.


                                                                                                                           3/25/11   8:16 PM
                             12_9780470911082-ch07.indd   121                                                              3/25/11   8:16 PM
                             12_9780470911082-ch07.indd   121
   132   133   134   135   136   137   138   139   140   141   142