
Page 207 - Statistics for Environmental Engineers
P. 207
l1592_frame_Ch23 Page 207 Tuesday, December 18, 2001 2:44 PM
of the organism. A further simplification is that we will consider only two groups of organisms, whereas
many bioassay tests will have several groups.
The true difference in survival proportions ( p) that is to be detected with a given degree of confidence
must be specified. That difference (δ = p e − p c ) should be an amount that is deemed scientifically or
environmentally important. The subscript e indicates the exposed group and c indicates the control group.
The variance of a binomial response is Var( p) = p(1 − p)/n. In the experimental design problem, the
variances of the two groups are not equal. For example, using n = 20, p c = 0.95 and p e = 0.8, gives:
(
Var p e ) = p e 1 – p e )/n = 0.8 1 0.8)/20 = 0.008
(
(
–
and
Var p c ) = p c 1 – p c )/n = 0.95 1 0.95)/20 = 0.0024
(
(
(
–
As the difference increases, the variances become more unequal (for p = 0.99, Var( p) = 0.0005). This
distortion must be expected in the bioassay problem because the survival proportion in the control group
should approach 1.00. If it does not, the bioassay is probably invalid on biological grounds.
The transformation x = arcsin p will “stretch” the scale near p = 1.00 and make the variances more
nearly equal (Mowery et al., 1985). In the following equations, x is the transformed survival proportion
and the difference to be detected is:
δ = x c – x e = arcsin p c – arcsin p e
For a binomial process, δ is approximately normally distributed. The difference of the two proportions is
also normally distributed. When x is measured in radians, Var(x) = 1/4n. Thus, Var(δ) = Var(x 1 − x 2 ) = 1/4n
+ 1/4n = 1/2n. These results are used below.
Figure 23.1 describes this experiment, with one small change. Here we are doing a one-sided test, so
the left-hand normal distribution will have the entire probability α assigned to the upper tail, where α
is the probability of rejecting the null hypothesis and inferring that an effect is real when it is not. The
true difference must be the distance (z α + z β ) in order to have probability β of detecting a real effect at
significance level α. Algebraically this is:
δ
z α + z β = ---------------
0.5n
The denominator is the standard error of δ. Rearranging this gives:
1 z α + z β 2
n = --- ---------------
2 δ
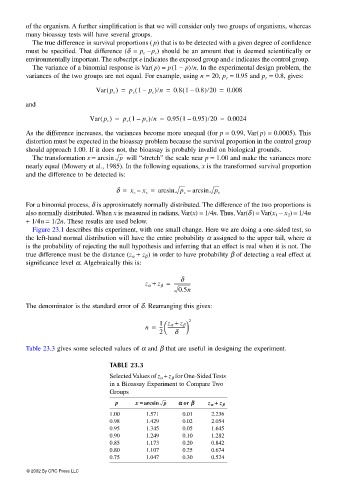
Table 23.3 gives some selected values of α and β that are useful in designing the experiment.
TABLE 23.3
Selected Values of z α + z β for One-Sided Tests
in a Bioassay Experiment to Compare Two
Groups
p x == == arcsin p αα αα or ββ ββ z αα αα ++ ++ z ββ ββ
1.00 1.571 0.01 2.236
0.98 1.429 0.02 2.054
0.95 1.345 0.05 1.645
0.90 1.249 0.10 1.282
0.85 1.173 0.20 0.842
0.80 1.107 0.25 0.674
0.75 1.047 0.30 0.524
© 2002 By CRC Press LLC