Page 209 - Statistics for Environmental Engineers
P. 209

l1592_frame_Ch23  Page 209  Tuesday, December 18, 2001  2:44 PM
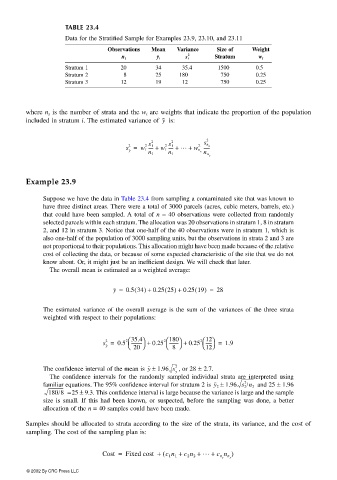


                                  TABLE 23.4
                                  Data for the Stratified Sample for Examples 23.9, 23.10, and 23.11
                                             Observations  Mean  Variance   Size of   Weight
                                                                    2
                                                 n i       y i     s i     Stratum     w i

                                  Stratum 1      20        34     35.4      1500      0.5
                                  Stratum 2       8        25    180         750      0.25
                                  Stratum 3      12        19     12         750      0.25


                       where n s  is the number of strata and the w i  are weights that indicate the proportion of the population
                       included in stratum i. The estimated variance of   is:
                                                            y

                                                         2     2        s n 2
                                                  s =  w 1 ---- +  w 1 ---- +  … +  w n ------ s
                                                   2
                                                        2 s 1
                                                             2 s 1
                                                                      2
                                                   y                   s
                                                         n 1  n 1       n n
                                                                         s
                       Example 23.9
                           Suppose we have the data in Table 23.4 from sampling a contaminated site that was known to
                           have three distinct areas. There were a total of 3000 parcels (acres, cubic meters, barrels, etc.)
                           that could have been sampled. A total of n = 40 observations were collected from randomly
                           selected parcels within each stratum. The allocation was 20 observations in stratum 1, 8 in stratum
                           2, and 12 in stratum 3. Notice that one-half of the 40 observations were in stratum 1, which is
                           also one-half of the population of 3000 sampling units, but the observations in strata 2 and 3 are
                           not proportional to their populations. This allocation might have been made because of the relative
                           cost of collecting the data, or because of some expected characteristic of the site that we do not
                           know about. Or, it might just be an inefficient design. We will check that later.
                             The overall mean is estimated as a weighted average:

                                                                      (
                                                             (
                                                     (
                                               y =  0.5 34) +  0.25 25) +  0.25 19) =  28
                           The estimated  variance of the  overall  average is the sum of the  variances of the three strata
                           weighted with respect to their populations:

                                                                 
                                                             2 180
                                                              
                                                                          
                                                                        
                                                                       2 12
                                                   
                                                       
                                                  2 35.4
                                            s =  0.5 ---------- +  0.25 --------- +  0.25 ------ =  1.9
                                             2
                                             y       20       8      12
                           The confidence interval of the mean is y ±  1.96 s  2  , or 28 ± 2.7.
                                                                y
                             The confidence intervals for the randomly sampled individual strata are interpreted using
                           familiar equations. The 95% confidence interval for stratum 2 is y 2 ±  1.96 s 2 /n 2   and 25 ± 1.96
                                                                                   2
                             180/8   = 25 ± 9.3. This confidence interval is large because the variance is large and the sample
                           size is small. If this had been known, or suspected, before the sampling  was done, a better
                           allocation of the n = 40 samples could have been made.
                       Samples should be allocated to strata according to the size of the strata, its variance, and the cost of
                       sampling. The cost of the sampling plan is:
                                            Cost =  Fixed cost  + ( c 1 n 1 +  c 2 n 2 +  … +  c n s  n n s )
                       © 2002 By CRC Press LLC
   204   205   206   207   208   209   210   211   212   213   214