
Page 205 - Statistics for Environmental Engineers
P. 205
l1592_frame_Ch23 Page 205 Tuesday, December 18, 2001 2:44 PM
The variance of the interaction effect is:
(
(
Var I() = Var y A2 ) + Var y A1 ) + Var y B2 ) + Var y B1 )
(
(
2
Assume that the variance of each average is σ /r, where r is the number of replicate specimens collected
from each area. This gives:
σ 2 σ 2 σ 2 σ 2 4σ 2
Var I() = ------ + ------ + ------ + ------ = ---------
r r r r r
The approximate 95% confidence interval of the interaction I is:
4σ
I ± 2 --------- 2 or I ± 4σ
------
r r
If only one specimen were collected per area, the confidence interval would be 4σ. Four specimens per
area gives a confidence interval of 2σ, 16 specimens gives 1σ, etc. in the same pattern we saw earlier.
Each quadrupling of the sample size reduces the confidence interval by half.
The number of replicates from each area needed to estimate the interaction Ι with a maximum error
of E = 2(4σ / r ) = 8σ / r is:
r = 64σ /E 2
2
The total sample size is 4r.
One-Way Analysis of Variance
The next chapter deals with comparing k mean values using analysis of variance (ANOVA). Here we
somewhat prematurely consider the sample size requirements. Kastenbaum et al. (1970) give tables for
sample size requirements when the means of k groups, each containing n observations, are being compared
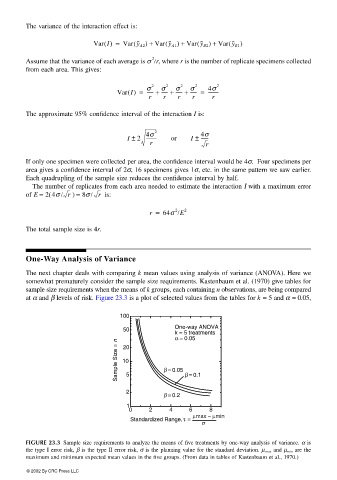
at α and β levels of risk. Figure 23.3 is a plot of selected values from the tables for k = 5 and α = 0.05,
100
One-way ANOVA
50
k = 5 treatments
α = 0.05
Sample Size = n 10 5 β = 0.05 β = 0.1
20
2
β = 0.2
1
0 2 4 6 8
Standardized Range, τ = µmax − µmin
σ
FIGURE 23.3 Sample size requirements to analyze the means of five treatments by one-way analysis of variance. α is
the type I error risk, β is the type II error risk, σ is the planning value for the standard deviation. µ max and µ min are the
maximum and minimum expected mean values in the five groups. (From data in tables of Kastenbaum et al., 1970.)
© 2002 By CRC Press LLC