
Page 216 - Statistics for Environmental Engineers
P. 216
L1592_frame_C24.fm Page 217 Tuesday, December 18, 2001 2:45 PM
2
3. If the true means do vary from treatment to treatment, s b will be inflated and it will tend to
2
be larger than s w .
4. The null hypothesis is that no difference exists between the k means. It is tested by checking
2 2 2 2 2
to see whether the two estimates of σ (s b and s w ) are the same. Strict equality (s w = s b )
of these two variances is not expected because of random variation; but if the null hypothesis
is true, they will be of the same magnitude. Roughly speaking, the same magnitude means
2 2
that the ratio s b /s w will be no larger than about 2.5 to 5.0. More precisely, this ratio is
compared with the F statistic having k − 1 degrees of freedom in the numerator and N − k
2 2
degrees of freedom in the denominator (i.e., the degree of freedom are the same as s b and s w ).
2 2
If s b and s w are of the same magnitude, there is no strong evidence to support a conclusion
2 2 2
that the means are different. On the other hand, an indication that s b is inflated (large s b /s w )
supports a conclusion that there is a difference between treatments.
2
The sample variances have a χ distribution. Ratios of sample variances are distributed according to
2
the F distribution. The χ and F are skewed distributions whose exact shape depends on the degrees of
freedom involved. The distributions are related to each other in much the same way that the normal and
t distributions are related in the t-test. The two estimates of σ 2 are compared using the analysis of
variance (ANOVA) table and the F test.
An Example Calculation
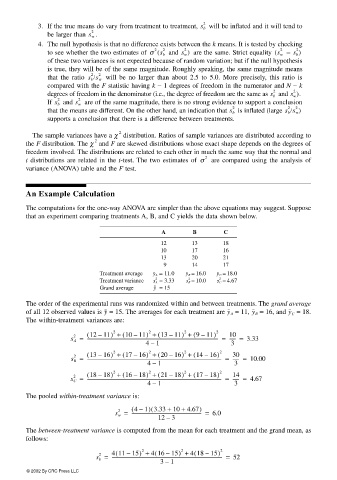
The computations for the one-way ANOVA are simpler than the above equations may suggest. Suppose
that an experiment comparing treatments A, B, and C yields the data shown below.
A B C
12 13 18
10 17 16
13 20 21
9 14 17
Treatment average y A = 11.0 y B = 16.0 y C = 18.0
Treatment variance s A 2 = 3.33 s B 2 = 10.0 s C 2 = 4.67
Grand average y = 15
The order of the experimental runs was randomized within and between treatments. The grand average
y = 18.
y B
y A
of all 12 observed values is = 15. The averages for each treatment are = 11, = 16, and y C
The within-treatment variances are:
( 12 11) + ( 10 11) + ( 13 11) + ( 911) 2 10
2
2
2
–
–
–
–
s A = ------------------------------------------------------------------------------------------------------------------- = ------ = 3.33
2
–
41 3
( 13 16) + ( 17 16) + ( 20 16) + ( 14 16) 2 30
2
2
2
–
–
–
–
s B = ---------------------------------------------------------------------------------------------------------------------- = ------ = 10.00
2
41 3
–
( 18 18) + ( 16 18) + ( 21 18) + ( 17 18) 2 14
2
2
2
–
–
–
–
s C = ---------------------------------------------------------------------------------------------------------------------- = ------ = 4.67
2
41 3
–
The pooled within-treatment variance is:
(
( 41) 3.33 + 10 + 4.67)
–
s w = ------------------------------------------------------------- = 6.0
2
12 3
–
The between-treatment variance is computed from the mean for each treatment and the grand mean, as
follows:
(
(
411 15) + 416 15) + 418 15) 2
(
2
2
–
–
–
s b = ------------------------------------------------------------------------------------------------- = 52
2
31
–
© 2002 By CRC Press LLC