
Page 218 - Statistics for Environmental Engineers
P. 218
L1592_frame_C24.fm Page 219 Tuesday, December 18, 2001 2:45 PM
TABLE 24.3
ANOVA Table for the Comparison of Five Laboratories
Source of Sum of Degrees of Mean F
Variation Squares Freedom Square Ratio
Between laboratories 13.88 4 3.47 6.81
Within laboratories 22.94 45 0.51
Total 36.82 49
Between-Lab Variation (y t - y) 1. 0 0 Lab 3 • • • •
Lab 1
Lab 2
Lab 5
-1
.0
-1.0 0 1.0 Lab 4 •
Within-Lab Variation (y - y )
ti t
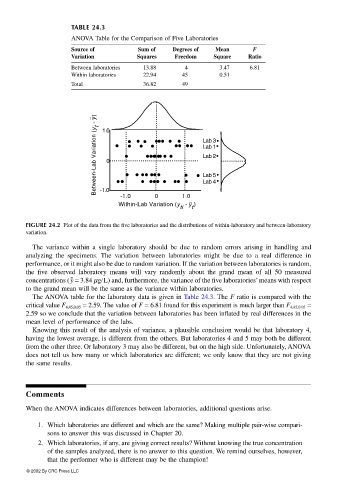
FIGURE 24.2 Plot of the data from the five laboratories and the distributions of within-laboratory and between-laboratory
variation.
The variance within a single laboratory should be due to random errors arising in handling and
analyzing the specimens. The variation between laboratories might be due to a real difference in
performance, or it might also be due to random variation. If the variation between laboratories is random,
the five observed laboratory means will vary randomly about the grand mean of all 50 measured
concentrations ( = 3.84 µg/L) and, furthermore, the variance of the five laboratories’ means with respecty
to the grand mean will be the same as the variance within laboratories.
The ANOVA table for the laboratory data is given in Table 24.3. The F ratio is compared with the
critical value F 4,45,0.05 = 2.59. The value of F = 6.81 found for this experiment is much larger than F 4,45,0.05 =
2.59 so we conclude that the variation between laboratories has been inflated by real differences in the
mean level of performance of the labs.
Knowing this result of the analysis of variance, a plausible conclusion would be that laboratory 4,
having the lowest average, is different from the others. But laboratories 4 and 5 may both be different
from the other three. Or laboratory 3 may also be different, but on the high side. Unfortunately, ANOVA
does not tell us how many or which laboratories are different; we only know that they are not giving
the same results.
Comments
When the ANOVA indicates differences between laboratories, additional questions arise.
1. Which laboratories are different and which are the same? Making multiple pair-wise compari-
sons to answer this was discussed in Chapter 20.
2. Which laboratories, if any, are giving correct results? Without knowing the true concentration
of the samples analyzed, there is no answer to this question. We remind ourselves, however,
that the performer who is different may be the champion!
© 2002 By CRC Press LLC