
Page 222 - Statistics for Environmental Engineers
P. 222
L1592_frame_C25.fm Page 224 Tuesday, December 18, 2001 2:45 PM
TABLE 25.1
Three Sets of Ten Measurements that Reflect Different Sources of Variation
Ten Tests on One Ten Specimens Each Ten Batches Each
Specimen Tested Once Sampled and Tested Once
36.6 34.5 39.2
36.4 40.2 33.8
38.3 38.4 41.5
37.4 41.9 47.3
36.7 34.9 31.1
37.6 39.5 31.3
35.8 36.7 41.2
36.7 38.3 36.7
37.4 37.5 39.4
37.1 37.2 48.4
= 37.0 = 37.9 = 39.0
y t y s y p
V t = 0.50 V s = 5.21 V p = 35.79
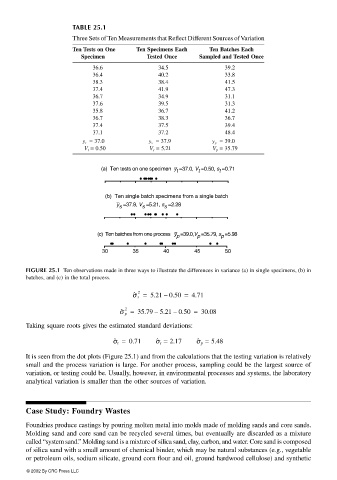
(a) Ten tests on one specimen y =37.0, V =0.50, s =0.71
t
t
t
(b) Ten single batch specimens from a single batch
y =37.9, V =5.21, s =2.28
s s s
(c) Ten batches from one process y =39.0,V =35.79, s =5.98
p p p
30 35 40 45 50
FIGURE 25.1 Ten observations made in three ways to illustrate the differences in variance (a) in single specimens, (b) in
batches, and (c) in the total process.
2
σ ˆ s = 5.21 0.50 = 4.71
–
σ ˆ p = 35.79 5.21 0.50 = 30.08
2
–
–
Taking square roots gives the estimated standard deviations:
σ ˆ t = 0.71 σ ˆ s = 2.17 σ ˆ p = 5.48
It is seen from the dot plots (Figure 25.1) and from the calculations that the testing variation is relatively
small and the process variation is large. For another process, sampling could be the largest source of
variation, or testing could be. Usually, however, in environmental processes and systems, the laboratory
analytical variation is smaller than the other sources of variation.
Case Study: Foundry Wastes
Foundries produce castings by pouring molten metal into molds made of molding sands and core sands.
Molding sand and core sand can be recycled several times, but eventually are discarded as a mixture
called “system sand.” Molding sand is a mixture of silica sand, clay, carbon, and water. Core sand is composed
of silica sand with a small amount of chemical binder, which may be natural substances (e.g., vegetable
or petroleum oils, sodium silicate, ground corn flour and oil, ground hardwood cellulose) and synthetic
© 2002 By CRC Press LLC