
Page 220 - Statistics for Environmental Engineers
P. 220
L1592_frame_C24.fm Page 221 Tuesday, December 18, 2001 2:45 PM
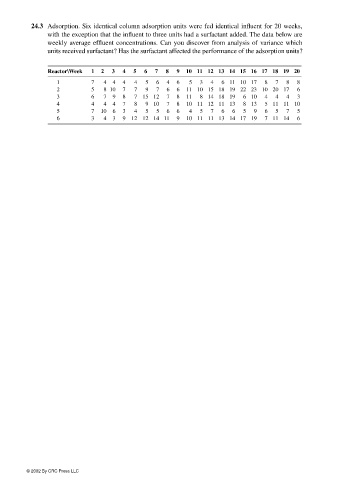
24.3 Adsorption. Six identical column adsorption units were fed identical influent for 20 weeks,
with the exception that the influent to three units had a surfactant added. The data below are
weekly average effluent concentrations. Can you discover from analysis of variance which
units received surfactant? Has the surfactant affected the performance of the adsorption units?
Reactor\Week 1 2 3 4 5 6 7 8 9 10 11 12 13 14 15 16 17 18 19 20
1 7 4 4 4 4 5 6 4 6 5 3 4 6 11 10 17 8 7 8 8
2 5 8 10 7 7 9 7 6 6 11101518192223102017 6
3 6 7 9 8 7 15 12 7 8 11 8 14 18 19 6 10 4 4 4 3
4 4 4 4 7 8 910 7 8 1011121113 813 5111110
5 7 10 6 3 4 5 5 6 6 4 5 7 6 6 5 9 6 5 7 5
6 3 4 3 9 12 12 14 11 9 10 11 11 13 14 17 19 7 11 14 6
© 2002 By CRC Press LLC