
Page 31 - Statistics for Environmental Engineers
P. 31
L1592_Frame_C02 Page 22 Tuesday, December 18, 2001 1:40 PM
95% conf.
interval
90% conf.
interval
6.5 7.0 7.5 8.0 8.5
Est. mean = True
7.51 mg/L concentration
= 8 mg/L
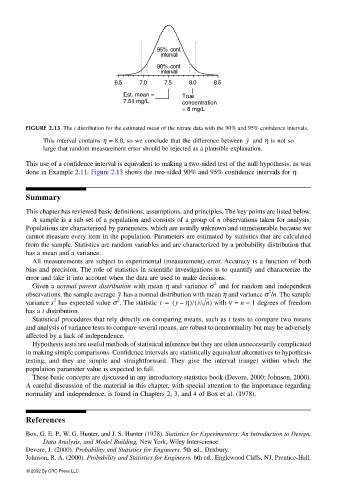
FIGURE 2.13 The t distribution for the estimated mean of the nitrate data with the 90% and 95% confidence intervals.
y
This interval contains η = 8.0, so we conclude that the difference between and η is not so
large that random measurement error should be rejected as a plausible explanation.
This use of a confidence interval is equivalent to making a two-sided test of the null hypothesis, as was
done in Example 2.11. Figure 2.13 shows the two-sided 90% and 95% confidence intervals for η.
Summary
This chapter has reviewed basic definitions, assumptions, and principles. The key points are listed below.
A sample is a sub-set of a population and consists of a group of n observations taken for analysis.
Populations are characterized by parameters, which are usually unknown and unmeasurable because we
cannot measure every item in the population. Parameters are estimated by statistics that are calculated
from the sample. Statistics are random variables and are characterized by a probability distribution that
has a mean and a variance.
All measurements are subject to experimental (measurement) error. Accuracy is a function of both
bias and precision. The role of statistics in scientific investigations is to quantify and characterize the
error and take it into account when the data are used to make decisions.
2
Given a normal parent distribution with mean η and variance σ and for random and independent
2
observations, the sample average has a normal distribution with mean η and variance σ /n. The sampley
2
2
variance s has expected value σ . The statistic t = (y η)/(s/ n) with ν = n − 1 degrees of freedom
–
has a t distribution.
Statistical procedures that rely directly on comparing means, such as t tests to compare two means
and analysis of variance tests to compare several means, are robust to nonnormality but may be adversely
affected by a lack of independence.
Hypothesis tests are useful methods of statistical inference but they are often unnecessarily complicated
in making simple comparisons. Confidence intervals are statistically equivalent alternatives to hypothesis
testing, and they are simple and straightforward. They give the interval (range) within which the
population parameter value is expected to fall.
These basic concepts are discussed in any introductory statistics book (Devore, 2000; Johnson, 2000).
A careful discussion of the material in this chapter, with special attention to the importance regarding
normality and independence, is found in Chapters 2, 3, and 4 of Box et al. (1978).
References
Box, G. E. P., W. G. Hunter, and J. S. Hunter (1978). Statistics for Experimenters: An Introduction to Design,
Data Analysis, and Model Building, New York, Wiley Interscience.
Devore, J. (2000). Probability and Statistics for Engineers, 5th ed., Duxbury.
Johnson, R. A. (2000). Probability and Statistics for Engineers, 6th ed., Englewood Cliffs, NJ, Prentice-Hall.
© 2002 By CRC Press LLC