
Page 26 - Statistics for Environmental Engineers
P. 26
α
t
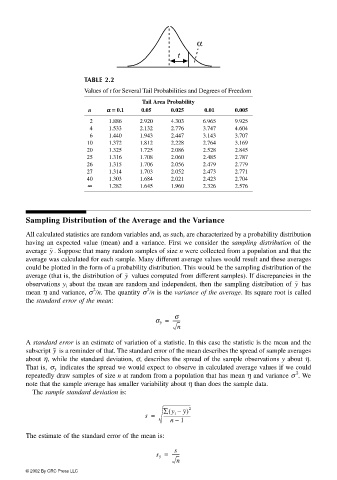
TABLE 2.2
Values of t for Several Tail Probabilities and Degrees of Freedom
Tail Area Probability
n αα αα == == 0.1 0.05 0.025 0.01 0.005
2 1.886 2.920 4.303 6.965 9.925
4 1.533 2.132 2.776 3.747 4.604
6 1.440 1.943 2.447 3.143 3.707
10 1.372 1.812 2.228 2.764 3.169
20 1.325 1.725 2.086 2.528 2.845
25 1.316 1.708 2.060 2.485 2.787
26 1.315 1.706 2.056 2.479 2.779
27 1.314 1.703 2.052 2.473 2.771
40 1.303 1.684 2.021 2.423 2.704
∞∞ ∞ ∞ 1.282 1.645 1.960 2.326 2.576
Sampling Distribution of the Average and the Variance
All calculated statistics are random variables and, as such, are characterized by a probability distribution
having an expected value (mean) and a variance. First we consider the sampling distribution of the
y
average . Suppose that many random samples of size n were collected from a population and that the
average was calculated for each sample. Many different average values would result and these averages
could be plotted in the form of a probability distribution. This would be the sampling distribution of the
y
average (that is, the distribution of values computed from different samples). If discrepancies in the
observations y i about the mean are random and independent, then the sampling distribution of hasy
2
2
mean η and variance, σ n. The quantity σ n is the variance of the average. Its square root is called
the standard error of the mean:
σ
σ y = -------
n
A standard error is an estimate of variation of a statistic. In this case the statistic is the mean and the
y
subscript is a reminder of that. The standard error of the mean describes the spread of sample averages
about η, while the standard deviation, σ, describes the spread of the sample observations y about η.
indicates the spread we would expect to observe in calculated average values if we could
That is, σ y
2
repeatedly draw samples of size n at random from a population that has mean η and variance σ . We
note that the sample average has smaller variability about η than does the sample data.
The sample standard deviation is:
∑ y i –( y) 2
s = ------------------------
–
n 1
The estimate of the standard error of the mean is:
s
s y = -------
n
© 2002 By CRC Press LLC