
Page 21 - Statistics for Environmental Engineers
P. 21
L1592_Frame_C02 Page 12 Tuesday, December 18, 2001 1:40 PM
Precision has to do with the scatter between repeated measurements. This scatter is caused by random
errors in the measurements. Precise results have small random errors. The standard deviation, s, is often
used as an index of precision (or imprecision). When s is large, the measurements are imprecise. Random
errors can never be eliminated, although by careful technique they can be minimized. Their effect can
be reduced by making repeated measurements and averaging them. Making replicate measures also
provides the means to quantify the measurement errors and evaluate their importance.
Example 2.3
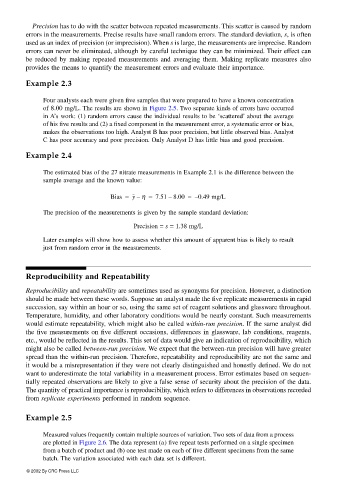
Four analysts each were given five samples that were prepared to have a known concentration
of 8.00 mg/L. The results are shown in Figure 2.5. Two separate kinds of errors have occurred
in A’s work: (1) random errors cause the individual results to be ‘scattered’ about the average
of his five results and (2) a fixed component in the measurement error, a systematic error or bias,
makes the observations too high. Analyst B has poor precision, but little observed bias. Analyst
C has poor accuracy and poor precision. Only Analyst D has little bias and good precision.
Example 2.4
The estimated bias of the 27 nitrate measurements in Example 2.1 is the difference between the
sample average and the known value:
Bias = y η– = 7.51 8.00 = – 0.49 mg/L
–
The precision of the measurements is given by the sample standard deviation:
Precision = s = 1.38 mg/L
Later examples will show how to assess whether this amount of apparent bias is likely to result
just from random error in the measurements.
Reproducibility and Repeatability
Reproducibility and repeatability are sometimes used as synonyms for precision. However, a distinction
should be made between these words. Suppose an analyst made the five replicate measurements in rapid
succession, say within an hour or so, using the same set of reagent solutions and glassware throughout.
Temperature, humidity, and other laboratory conditions would be nearly constant. Such measurements
would estimate repeatability, which might also be called within-run precision. If the same analyst did
the five measurements on five different occasions, differences in glassware, lab conditions, reagents,
etc., would be reflected in the results. This set of data would give an indication of reproducibility, which
might also be called between-run precision. We expect that the between-run precision will have greater
spread than the within-run precision. Therefore, repeatability and reproducibility are not the same and
it would be a misrepresentation if they were not clearly distinguished and honestly defined. We do not
want to underestimate the total variability in a measurement process. Error estimates based on sequen-
tially repeated observations are likely to give a false sense of security about the precision of the data.
The quantity of practical importance is reproducibility, which refers to differences in observations recorded
from replicate experiments performed in random sequence.
Example 2.5
Measured values frequently contain multiple sources of variation. Two sets of data from a process
are plotted in Figure 2.6. The data represent (a) five repeat tests performed on a single specimen
from a batch of product and (b) one test made on each of five different specimens from the same
batch. The variation associated with each data set is different.
© 2002 By CRC Press LLC