
Page 22 - Statistics for Environmental Engineers
P. 22
L1592_Frame_C02 Page 13 Tuesday, December 18, 2001 1:40 PM
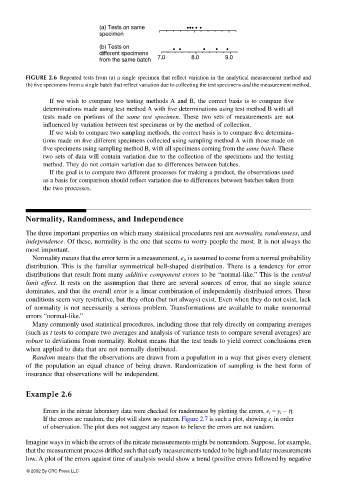
(a) Tests on same • • ••
•
specimen
(b) Tests on • • • • •
different specimens
from the same batch 7.0 8.0 9.0
FIGURE 2.6 Repeated tests from (a) a single specimen that reflect variation in the analytical measurement method and
(b) five specimens from a single batch that reflect variation due to collecting the test specimens and the measurement method.
If we wish to compare two testing methods A and B, the correct basis is to compare five
determinations made using test method A with five determinations using test method B with all
tests made on portions of the same test specimen. These two sets of measurements are not
influenced by variation between test specimens or by the method of collection.
If we wish to compare two sampling methods, the correct basis is to compare five determina-
tions made on five different specimens collected using sampling method A with those made on
five specimens using sampling method B, with all specimens coming from the same batch. These
two sets of data will contain variation due to the collection of the specimens and the testing
method. They do not contain variation due to differences between batches.
If the goal is to compare two different processes for making a product, the observations used
as a basis for comparison should reflect variation due to differences between batches taken from
the two processes.
Normality, Randomness, and Independence
The three important properties on which many statistical procedures rest are normality, randomness, and
independence. Of these, normality is the one that seems to worry people the most. It is not always the
most important.
Normality means that the error term in a measurement, e i , is assumed to come from a normal probability
distribution. This is the familiar symmetrical bell-shaped distribution. There is a tendency for error
distributions that result from many additive component errors to be “normal-like.” This is the central
limit effect. It rests on the assumption that there are several sources of error, that no single source
dominates, and that the overall error is a linear combination of independently distributed errors. These
conditions seem very restrictive, but they often (but not always) exist. Even when they do not exist, lack
of normality is not necessarily a serious problem. Transformations are available to make nonnormal
errors “normal-like.”
Many commonly used statistical procedures, including those that rely directly on comparing averages
(such as t tests to compare two averages and analysis of variance tests to compare several averages) are
robust to deviations from normality. Robust means that the test tends to yield correct conclusions even
when applied to data that are not normally distributed.
Random means that the observations are drawn from a population in a way that gives every element
of the population an equal chance of being drawn. Randomization of sampling is the best form of
insurance that observations will be independent.
Example 2.6
Errors in the nitrate laboratory data were checked for randomness by plotting the errors, e i = y i − η.
If the errors are random, the plot will show no pattern. Figure 2.7 is such a plot, showing e i in order
of observation. The plot does not suggest any reason to believe the errors are not random.
Imagine ways in which the errors of the nitrate measurements might be nonrandom. Suppose, for example,
that the measurement process drifted such that early measurements tended to be high and later measurements
low. A plot of the errors against time of analysis would show a trend (positive errors followed by negative
© 2002 By CRC Press LLC