
Page 20 - Statistics for Environmental Engineers
P. 20
L1592_Frame_C02 Page 11 Tuesday, December 18, 2001 1:40 PM
n − 1 of the deviations or residuals completely determines the one remaining residual. The n residuals,
and hence their sum of squares and sample variance, are said therefore to have n − 1 degrees of freedom.
Degrees of freedom will be denoted by the Greek letter ν. For the sample variance and sample standard
deviation, ν = n − 1.
Most of the time, “sample” will be dropped from sample standard deviation, sample variance, and
sample average. It should be clear from the context that the calculated statistics are being discussed.
2 2
The Roman letters, for example s , s, and , will indicate quantities that are statistics. Greek letters (σ ,y
σ, and η) indicate parameters.
Example 2.2
For the 27 nitrate observations, the sample average is
6.9 + 7.8 + … + 8.1 + 7.9
y = ------------------------------------------------------------- = 7.51 mg/L
27
The sample variance is
( 6.9 7.51) + … + ( 7.9 7.51) 2
2
–
–
s = -------------------------------------------------------------------------------- = 1.9138 (mg/L) 2
2
–
27 1
The sample standard deviation is
s = 1.9138 = 1.38 mg/L
The sample variance and sample standard deviation have ν = 27 − 1 = 26 degrees of freedom.
The data were reported with two significant figures. The average of several values should be calculated
with at least one more figure than that of the data. The standard deviation should be computed to at
least three significant figures (Taylor, 1987).
Accuracy, Bias, and Precision
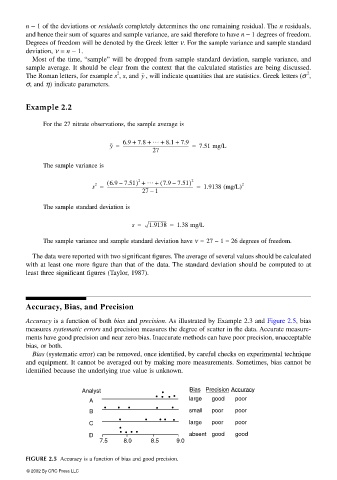
Accuracy is a function of both bias and precision. As illustrated by Example 2.3 and Figure 2.5, bias
measures systematic errors and precision measures the degree of scatter in the data. Accurate measure-
ments have good precision and near zero bias. Inaccurate methods can have poor precision, unacceptable
bias, or both.
Bias (systematic error) can be removed, once identified, by careful checks on experimental technique
and equipment. It cannot be averaged out by making more measurements. Sometimes, bias cannot be
identified because the underlying true value is unknown.
Bias _Precision _Accuracy
Analyst • _
• • • •
A large good poor
• • • • •
B small poor poor
• • • • •
C large poor poor
•
• • • •
D absent good good
7.5 8.0 8.5 9.0
FIGURE 2.5 Accuracy is a function of bias and good precision.
© 2002 By CRC Press LLC