
Page 23 - Statistics for Environmental Engineers
P. 23
L1592_Frame_C02 Page 14 Tuesday, December 18, 2001 1:40 PM
4
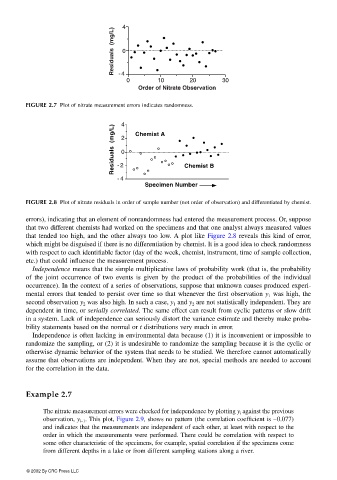
Residuals (mg/L) 0
-4
0 10 20 30
Order of Nitrate Observation
FIGURE 2.7 Plot of nitrate measurement errors indicates randomness.
4 Chemist A
Residuals (mg/L) 2 0
-2
-4 Chemist B
Specimen Number
FIGURE 2.8 Plot of nitrate residuals in order of sample number (not order of observation) and differentiated by chemist.
errors), indicating that an element of nonrandomness had entered the measurement process. Or, suppose
that two different chemists had worked on the specimens and that one analyst always measured values
that tended too high, and the other always too low. A plot like Figure 2.8 reveals this kind of error,
which might be disguised if there is no differentiation by chemist. It is a good idea to check randomness
with respect to each identifiable factor (day of the week, chemist, instrument, time of sample collection,
etc.) that could influence the measurement process.
Independence means that the simple multiplicative laws of probability work (that is, the probability
of the joint occurrence of two events is given by the product of the probabilities of the individual
occurrence). In the context of a series of observations, suppose that unknown causes produced experi-
mental errors that tended to persist over time so that whenever the first observation y 1 was high, the
second observation y 2 was also high. In such a case, y 1 and y 2 are not statistically independent. They are
dependent in time, or serially correlated. The same effect can result from cyclic patterns or slow drift
in a system. Lack of independence can seriously distort the variance estimate and thereby make proba-
bility statements based on the normal or t distributions very much in error.
Independence is often lacking in environmental data because (1) it is inconvenient or impossible to
randomize the sampling, or (2) it is undesirable to randomize the sampling because it is the cyclic or
otherwise dynamic behavior of the system that needs to be studied. We therefore cannot automatically
assume that observations are independent. When they are not, special methods are needed to account
for the correlation in the data.
Example 2.7
The nitrate measurement errors were checked for independence by plotting y i against the previous
observation, y i−1 . This plot, Figure 2.9, shows no pattern (the correlation coefficient is –0.077)
and indicates that the measurements are independent of each other, at least with respect to the
order in which the measurements were performed. There could be correlation with respect to
some other characteristic of the specimens, for example, spatial correlation if the specimens come
from different depths in a lake or from different sampling stations along a river.
© 2002 By CRC Press LLC