
Page 152 - Sustainability in the Process Industry Integration and Optimization
P. 152
Fu r t h e r A p p l i c a t i o n s o f P r o c e s s I n t e g r a t i o n 129
The configuration of wastewater treatment serves as an aid in
establishing whether or not wastewater treatment costs that are
based on quality and quantity differ significantly from costs based
on quantity only.
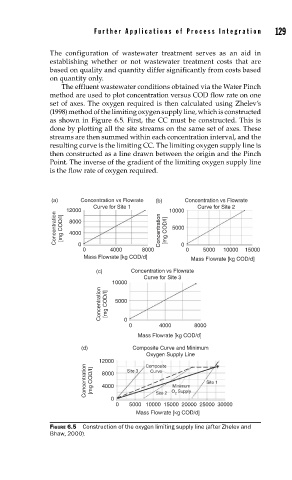
The effluent wastewater conditions obtained via the Water Pinch
method are used to plot concentration versus COD flow rate on one
set of axes. The oxygen required is then calculated using Zhelev’s
(1998) method of the limiting oxygen supply line, which is constructed
as shown in Figure 6.5. First, the CC must be constructed. This is
done by plotting all the site streams on the same set of axes. These
streams are then summed within each concentration interval, and the
resulting curve is the limiting CC. The limiting oxygen supply line is
then constructed as a line drawn between the origin and the Pinch
Point. The inverse of the gradient of the limiting oxygen supply line
is the flow rate of oxygen required.
(a) Concentration vs Flowrate (b) Concentration vs Flowrate
Curve for Site 1 10000 Curve for Site 2
Concentration [mg COD/I] 12000 Concentration [mg COD/I] 5000
8000
4000
0
0 4000 8000 0 0 5000 10000 15000
Mass Flowrate [kg COD/d] Mass Flowrate [kg COD/d]
(c) Concentration vs Flowrate
Curve for Site 3
10000
Concentration [mg COD/I] 5000
0
0 4000 8000
Mass Flowrate [kg COD/d]
(d) Composite Curve and Minimum
Oxygen Supply Line
12000 Composite
Concentration [mg COD/I] 8000 Site 3 Curve Minimum Site 1
4000
0 Site 2 O 2 Supply
0 5000 10000 15000 20000 25000 30000
Mass Flowrate [kg COD/d]
FIGURE 6.5 Construction of the oxygen limiting supply line (after Zhelev and
Bhaw, 2000).