
Page 154 - Sustainability in the Process Industry Integration and Optimization
P. 154
Fu r t h e r A p p l i c a t i o n s o f P r o c e s s I n t e g r a t i o n 131
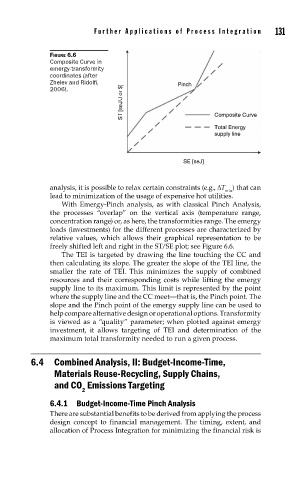
FIGURE 6.6
Composite Curve in
emergy-transformity
coordinates (after
Zhelev and Ridolfi , Pinch
ST [seJ/J or $] Composite Curve
2006).
Total Energy
supply line
SE [seJ]
analysis, it is possible to relax certain constraints (e.g., ΔT ) that can
min
lead to minimization of the usage of expensive hot utilities.
With Emergy-Pinch analysis, as with classical Pinch Analysis,
the processes “overlap” on the vertical axis (temperature range,
concentration range) or, as here, the transformities range. The emergy
loads (investments) for the different processes are characterized by
relative values, which allows their graphical representation to be
freely shifted left and right in the ST/SE plot; see Figure 6.6.
The TEI is targeted by drawing the line touching the CC and
then calculating its slope. The greater the slope of the TEI line, the
smaller the rate of TEI. This minimizes the supply of combined
resources and their corresponding costs while lifting the emergy
supply line to its maximum. This limit is represented by the point
where the supply line and the CC meet—that is, the Pinch point. The
slope and the Pinch point of the emergy supply line can be used to
help compare alternative design or operational options. Transformity
is viewed as a “quality” parameter; when plotted against emergy
investment, it allows targeting of TEI and determination of the
maximum total transformity needed to run a given process.
6.4 Combined Analysis, II: Budget-Income-Time,
Materials Reuse-Recycling, Supply Chains,
and CO Emissions Targeting
2
6.4.1 Budget-Income-Time Pinch Analysis
There are substantial benefits to be derived from applying the process
design concept to financial management. The timing, extent, and
allocation of Process Integration for minimizing the financial risk is