
Page 155 - Sustainability in the Process Industry Integration and Optimization
P. 155
132 Cha p te r S i x
the primary goal of such investigations, which also account for
possible uncertainties in model parameters. The concept of combined
resources management can lead to more realistic design solutions
while helping decision makers account for financial investments.
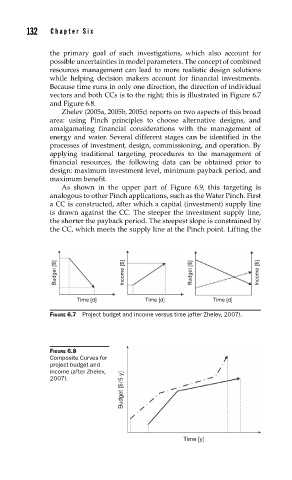
Because time runs in only one direction, the direction of individual
vectors and both CCs is to the right; this is illustrated in Figure 6.7
and Figure 6.8.
Zhelev (2005a, 2005b, 2005c) reports on two aspects of this broad
area: using Pinch principles to choose alternative designs, and
amalgamating financial considerations with the management of
energy and water. Several different stages can be identified in the
processes of investment, design, commissioning, and operation. By
applying traditional targeting procedures to the management of
financial resources, the following data can be obtained prior to
design: maximum investment level, minimum payback period, and
maximum benefit.
As shown in the upper part of Figure 6.9, this targeting is
analogous to other Pinch applications, such as the Water Pinch. First
a CC is constructed, after which a capital (investment) supply line
is drawn against the CC. The steeper the investment supply line,
the shorter the payback period. The steepest slope is constrained by
the CC, which meets the supply line at the Pinch point. Lifting the
Budget [$] Income [$] Budget [$] Income [$]
Time [d] Time [d] Time [d]
FIGURE 6.7 Project budget and income versus time (after Zhelev, 2007).
FIGURE 6.8
Composite Curves for
project budget and
income (after Zhelev,
Budget [$/5 y]
2007).
Time [y]