
Page 160 - Sustainability in the Process Industry Integration and Optimization
P. 160
Fu r t h e r A p p l i c a t i o n s o f P r o c e s s I n t e g r a t i o n 137
• Inventory I = inventory at the end of time period t
t
• Stock out S = number of units stocked out (backlogged) at
t
the end of time period t
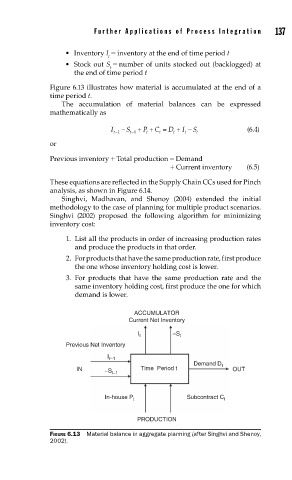
Figure 6.13 illustrates how material is accumulated at the end of a
time period t.
The accumulation of material balances can be expressed
mathematically as
I S P C D I S (6.4)
t 1 t 1 t t t t t
or
Previous inventory + Total production = Demand
+ Current inventory (6.5)
These equations are reflected in the Supply Chain CCs used for Pinch
analysis, as shown in Figure 6.14.
Singhvi, Madhavan, and Shenoy (2004) extended the initial
methodology to the case of planning for multiple product scenarios.
Singhvi (2002) proposed the following algorithm for minimizing
inventory cost:
1. List all the products in order of increasing production rates
and produce the products in that order.
2. For products that have the same production rate, first produce
the one whose inventory holding cost is lower.
3. For products that have the same production rate and the
same inventory holding cost, first produce the one for which
demand is lower.
ACCUMULATOR
Current Net Inventory
I t −S t
Previous Net Inventory
I r−1
Demand D t
IN −S t−1 Time Period t OUT
In-house P t Subcontract C t
PRODUCTION
FIGURE 6.13 Material balance in aggregate planning (after Singhvi and Shenoy,
2002).