
Page 161 - Sustainability in the Process Industry Integration and Optimization
P. 161
138 Cha p te r S i x
Ending inventory
6
5 Demand
Time [months] 4 3 d Δt Composite Curve Pinch point
I k
k
Production
1 2 Composite Curve
I t−1
P Δt + c k
k
0 5000 10000 15000 20000
I 0
Material quantity [units]
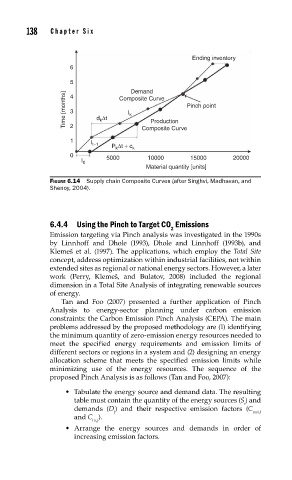
FIGURE 6.14 Supply chain Composite Curves (after Singhvi, Madhavan, and
Shenoy, 2004).
6.4.4 Using the Pinch to Target CO Emissions
2
Emission targeting via Pinch analysis was investigated in the 1990s
by Linnhoff and Dhole (1993), Dhole and Linnhoff (1993b), and
Klemeš et al. (1997). The applications, which employ the Total Site
concept, address optimization within industrial facilities, not within
extended sites as regional or national energy sectors. However, a later
work (Perry, Klemeš, and Bulatov, 2008) included the regional
dimension in a Total Site Analysis of integrating renewable sources
of energy.
Tan and Foo (2007) presented a further application of Pinch
Analysis to energy-sector planning under carbon emission
constraints: the Carbon Emission Pinch Analysis (CEPA). The main
problems addressed by the proposed methodology are (1) identifying
the minimum quantity of zero-emission energy resources needed to
meet the specified energy requirements and emission limits of
different sectors or regions in a system and (2) designing an energy
allocation scheme that meets the specified emission limits while
minimizing use of the energy resources. The sequence of the
proposed Pinch Analysis is as follows (Tan and Foo, 2007):
• Tabulate the energy source and demand data. The resulting
table must contain the quantity of the energy sources (S) and
i
demands (D) and their respective emission factors (C
j out,i
and C ).
in,j
• Arrange the energy sources and demands in order of
increasing emission factors.