
Page 159 - Sustainability in the Process Industry Integration and Optimization
P. 159
136 Cha p te r S i x
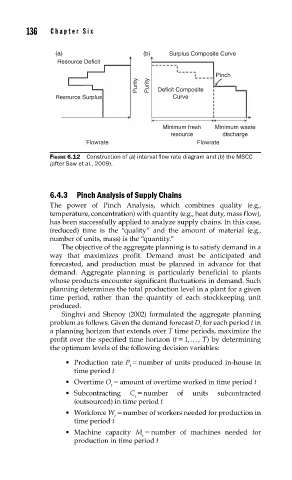
(a) (b) Surplus Composite Curve
Resource Deficit
Pinch
Purity Purity Deficit Composite
Resource Surplus Curve
Minimum fresh Minimum waste
resource discharge
Flowrate Flowrate
FIGURE 6.12 Construction of (a) interval fl ow rate diagram and (b) the MSCC
(after Saw et al., 2009).
6.4.3 Pinch Analysis of Supply Chains
The power of Pinch Analysis, which combines quality (e.g.,
temperature, concentration) with quantity (e.g., heat duty, mass flow),
has been successfully applied to analyze supply chains. In this case,
(reduced) time is the “quality” and the amount of material (e.g.,
number of units, mass) is the “quantity.”
The objective of the aggregate planning is to satisfy demand in a
way that maximizes profit. Demand must be anticipated and
forecasted, and production must be planned in advance for that
demand. Aggregate planning is particularly beneficial to plants
whose products encounter significant fluctuations in demand. Such
planning determines the total production level in a plant for a given
time period, rather than the quantity of each stockkeeping unit
produced.
Singhvi and Shenoy (2002) formulated the aggregate planning
problem as follows. Given the demand forecast D for each period t in
t
a planning horizon that extends over T time periods, maximize the
profit over the specified time horizon (t = 1, . . . , T) by determining
the optimum levels of the following decision variables:
• Production rate P = number of units produced in-house in
t
time period t
• Overtime O = amount of overtime worked in time period t
t
• Subcontracting C = number of units subcontracted
t
(outsourced) in time period t
• Workforce W = number of workers needed for production in
t
time period t
• Machine capacity M = number of machines needed for
t
production in time period t