
Page 256 - Sustainability in the Process Industry Integration and Optimization
P. 256
E x a m p l e s a n d Ca s e S t u d i e s 233
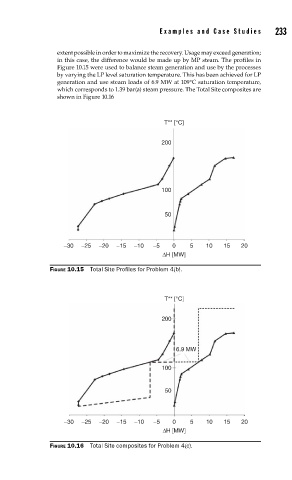
extent possible in order to maximize the recovery. Usage may exceed generation;
in this case, the difference would be made up by MP steam. The profiles in
Figure 10.15 were used to balance steam generation and use by the processes
by varying the LP level saturation temperature. This has been achieved for LP
generation and use steam loads of 6.9 MW at 109°C saturation temperature,
which corresponds to 1.39 bar(a) steam pressure. The Total Site composites are
shown in Figure 10.16
T** [°C]
200
100
50
−30 −25 −20 −15 −10 −5 0 5 10 15 20
ΔH [MW]
FIGURE 10.15 Total Site Profi les for Problem 4(b).
T** [°C]
200
6.9 MW
100
50
−30 −25 −20 −15 −10 −5 0 5 10 15 20
ΔH [MW]
FIGURE 10.16 Total Site composites for Problem 4(c).