Page 255 - Sustainability in the Process Industry Integration and Optimization
P. 255

232   Cha p te r  T e n


                                 Q    [MW]   Q    [MW]   Pinch (hot/cold) [°C]
                                   H,min      H,min
                       Process A  2.852      14.955      124 / 114
                       Process B  1.800      0           None (threshold problem)

                     TABLE 10.13  Heat Recovery Targets for Problem 4(a)


                          ∗
                         T [°C]
                                      (2.9; 165.0)
                           160
                           140  (0.3; 148.0)
                                 (0.3; 121.0)
                           120
                                                (8.9; 85.0)
                           100
                                (0; 119.0)
                                                         (10.3; 79.0)
                            80
                                              (9.9; 80.0)
                            60
                            40
                            20                                  (15.0; 32.5)
                            0
                              0    2    4    6    8   10   12   14  ΔH [MW]
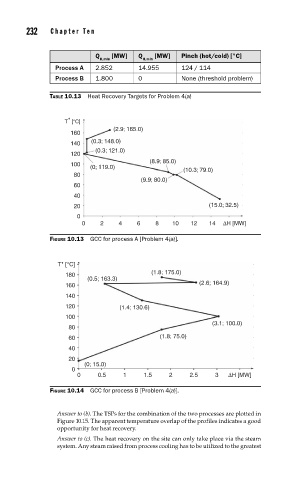
                     FIGURE 10.13  GCC for process A [Problem 4(a)].


                       T* [°C]
                                                 (1.8; 175.0)
                         180
                               (0.5; 163.3)
                         160                                  (2.6; 164.9)
                         140
                         120            (1.4; 130.6)
                         100
                                                                 (3.1; 100.0)
                          80
                          60                       (1.8; 75.0)
                          40
                          20
                              (0; 15.0)
                           0
                             0    0.5    1     1.5    2    2.5    3   ΔH [MW]
                     FIGURE 10.14  GCC for process B [Problem 4(a)].


                       Answer to (b). The TSPs for the combination of the two processes are plotted in
                       Figure 10.15. The apparent temperature overlap of the profiles indicates a good
                       opportunity for heat recovery.
                       Answer to (c). The heat recovery on the site can only take place via the steam
                       system. Any steam raised from process cooling has to be utilized to the greatest
   250   251   252   253   254   255   256   257   258   259   260