
Page 251 - Sustainability in the Process Industry Integration and Optimization
P. 251
228 Cha p te r T e n
(c) Construct the Total Site Profiles (TSPs).
(d) Assuming that the site manager is willing to accept just one
more steam main in addition to the HP, identify this steam
level on the Site Profiles. What saturation temperature will
yield the most energy savings?
(e) Determine the load target for this steam level.
Problem 3: Solutions
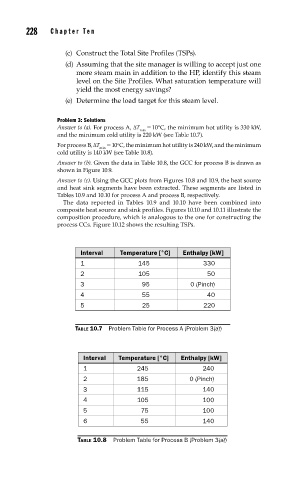
Answer to (a). For process A, ΔT = 10°C, the minimum hot utility is 330 kW,
min
and the minimum cold utility is 220 kW (see Table 10.7).
For process B, ΔT = 10 C, the minimum hot utility is 240 kW, and the minimum
o
min
cold utility is 140 kW (see Table 10.8).
Answer to (b). Given the data in Table 10.8, the GCC for process B is drawn as
shown in Figure 10.9.
Answer to (c). Using the GCC plots from Figures 10.8 and 10.9, the heat source
and heat sink segments have been extracted. These segments are listed in
Tables 10.9 and 10.10 for process A and process B, respectively.
The data reported in Tables 10.9 and 10.10 have been combined into
composite heat source and sink profiles. Figures 10.10 and 10.11 illustrate the
composition procedure, which is analogous to the one for constructing the
process CCs. Figure 10.12 shows the resulting TSPs.
Interval Temperature [°C] Enthalpy [kW]
1 145 330
2 105 50
3 95 0 (Pinch)
4 55 40
5 25 220
TABLE 10.7 Problem Table for Process A (Problem 3(a))
Interval Temperature [°C] Enthalpy [kW]
1 245 240
2 185 0 (Pinch)
3 115 140
4 105 100
5 75 100
6 55 140
TABLE 10.8 Problem Table for Process B (Problem 3(a))