Page 250 - Sustainability in the Process Industry Integration and Optimization
P. 250

E x a m p l e s  a n d Ca s e  S t u d i e s   227


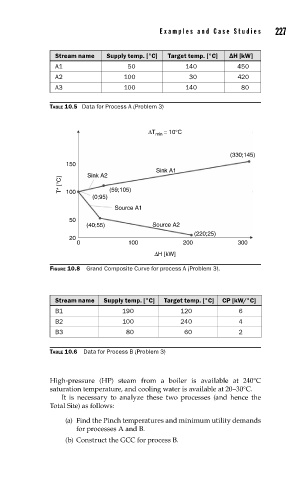
                       Stream name   Supply temp. [°C]  Target temp. [°C]  ΔH [kW]
                       A1                 50              140           450
                       A2                100               30           420
                       A3                100              140            80

                     TABLE 10.5  Data for Process A (Problem 3)


                                                ΔT min  = 10°C

                                                                      (330;145)
                         150
                                                  Sink A1
                               Sink A2
                        T* [°C]      (59;105)
                         100
                                 (0;95)
                                       Source A1
                          50
                               (40;55)           Source A2
                                                            (220;25)
                          20
                            0             100            200            300
                                                  ΔH [kW]

                     FIGURE 10.8  Grand Composite Curve for process A (Problem 3).


                       Stream name  Supply temp. [°C]  Target temp. [°C]  CP [kW/°C]
                       B1                190             120             6
                       B2                100             240             4
                       B3                 80              60             2


                     TABLE 10.6  Data for Process B (Problem 3)


                       High-pressure (HP) steam from a boiler is available at 240°C
                     saturation temperature, and cooling water is available at 20–30°C.
                        It is necessary to analyze these two processes (and hence the
                     Total Site) as follows:

                         (a)  Find the Pinch temperatures and minimum utility demands
                            for processes A and B.
                         (b) Construct the GCC for process B.
   245   246   247   248   249   250   251   252   253   254   255