Page 252 - Sustainability in the Process Industry Integration and Optimization
P. 252

E x a m p l e s  a n d Ca s e  S t u d i e s   229


                                                ΔT min =10°C
                                                                     (240;245)
                                                 Sink B1
                             (0;185)
                        200
                                 Source B1
                       T* [°C]                 (100;135)


                                                        (140;115)
                                        (100;105)
                        100                     Source B2
                                         (100;75)
                                                        (140;55)
                         40
                           0        50        100       150       200       250
                                                 ΔH [kW]
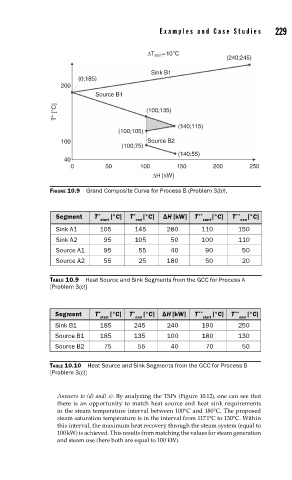
                     FIGURE 10.9  Grand Composite Curve for Process B (Problem 3(b)).


                       Segment   T  *   [°C]  T  *  [°C]  ΔH [kW]  T  **  [°C]  T  **  [°C]
                                   start    end                start     end
                       Sink A1     105      145      280      110       150
                       Sink A2      95      105       50      100       110
                       Source A1    95       55       40       90        50
                       Source A2    55       25      180       50        20


                     TABLE 10.9  Heat Source and Sink Segments from the GCC for Process A
                     [Problem 3(c)]


                       Segment   T  *    [°C]  T  *   [°C]  ΔH [kW]  T  **   [°C]  T  **   [°C]
                                   start    end                start     end
                       Sink B1     185      245      240      190       250
                       Source B1   185      135      100      180       130
                       Source B2    75       55       40        70       50

                     TABLE 10.10  Heat Source and Sink Segments from the GCC for Process B
                     [Problem 3(c)]


                       Answers to (d) and( e). By analyzing the TSPs (Figure 10.12), one can see that
                       there is an opportunity to match heat source and heat sink requirements
                       in the steam temperature interval between 100°C and 180°C. The proposed
                       steam saturation temperature is in the interval from 117.1°C to 130°C. Within
                       this interval, the maximum heat recovery through the steam system (equal to
                       100 kW) is achieved. This results from matching the values for steam generation
                       and steam use (here both are equal to 100 kW).
   247   248   249   250   251   252   253   254   255   256   257