Page 257 - Sustainability in the Process Industry Integration and Optimization
P. 257

234   Cha p te r  T e n


                10.3   Integrated Placement of Processing
                        Units and Data Extraction

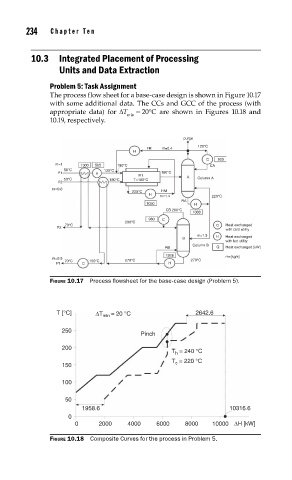
                     Problem 5: Task Assignment
                     The process flow sheet for a base-case design is shown in Figure 10.17
                     with some additional data. The CCs and GCC of the process (with
                     appropriate data) for ΔT   = 20°C are shown in Figures 10.18 and
                                          min
                     10.19, respectively.

                                                          purge
                                                             120°C
                                               FR   m=0.4
                                            H
                                                                C   900
                       m=1   1300   505   180°C                  CA
                         50°C       130°C
                       F1         H                180°C
                                             R1           A
                         50°C        180°C   T=180°C         Column A
                       F2
                      m=0.8
                                           220°C   HM
                                                H
                                                   m=1.4         220°C
                                                         RA
                                               1050         H
                                                     CB 200°C
                                                            1000
                                                980   C
                                          200°C
                         70°C                                     C   Heat exchanged
                       P2
                                                                     with cold utility
                                                             m=1.3
                                                         B        H   Heat exchanged
                                                                     with hot utility
                                                            Column B
                                                    RB             Q   Heat exchanged [kW]
                                                     1928            m=[kg/s]
                      m=0.5   70°C  150°C  270°C           270°C
                       P1     C                      H
                     FIGURE 10.17  Process fl owsheet for the base-case design (Problem 5).
                       T [°C]     ΔT min  = 20 °C            2642.6
                        250
                                              Pinch
                        200
                                                      T  = 240 °C
                                                       h
                                                      T  = 220 °C
                                                       c
                        150
                        100
                         50
                              1958.6                                  10316.6
                          0
                            0     2000    4000    6000    8000   10000 ΔH [kW]
                     FIGURE 10.18  Composite Curves for the process in Problem 5.
   252   253   254   255   256   257   258   259   260   261   262