
Page 254 - Sustainability in the Process Industry Integration and Optimization
P. 254
E x a m p l e s a n d Ca s e S t u d i e s 231
10.2.2 Total Sites: Second Problem
Problem 4: Task Assignment
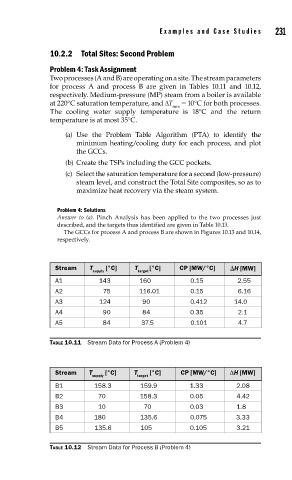
Two processes (A and B) are operating on a site. The stream parameters
for process A and process B are given in Tables 10.11 and 10.12,
respectively. Medium-pressure (MP) steam from a boiler is available
at 220°C saturation temperature, and ΔT = 10°C for both processes.
min
The cooling water supply temperature is 18°C and the return
temperature is at most 35°C.
(a) Use the Problem Table Algorithm (PTA) to identify the
minimum heating/cooling duty for each process, and plot
the GCCs.
(b) Create the TSPs including the GCC pockets.
(c) Select the saturation temperature for a second (low-pressure)
steam level, and construct the Total Site composites, so as to
maximize heat recovery via the steam system.
Problem 4: Solutions
Answer to (a). Pinch Analysis has been applied to the two processes just
described, and the targets thus identified are given in Table 10.13.
The GCCs for process A and process B are shown in Figures 10.13 and 10.14,
respectively.
Stream T [°C] T [°C] CP [MW/°C] ∆H [MW]
supply target
A1 143 160 0.15 2.55
A2 75 116.01 0.15 6.16
A3 124 90 0.412 14.0
A4 90 84 0.35 2.1
A5 84 37.5 0.101 4.7
TABLE 10.11 Stream Data for Process A (Problem 4)
Stream T [°C] T [°C] CP [MW/°C] ∆H [MW]
supply target
B1 158.3 159.9 1.33 2.08
B2 70 158.3 0.05 4.42
B3 10 70 0.03 1.8
B4 180 135.6 0.075 3.33
B5 135.6 105 0.105 3.21
TABLE 10.12 Stream Data for Process B (Problem 4)