Page 99 - Sustainability in the Process Industry Integration and Optimization
P. 99

76   Cha p te r  F o u r


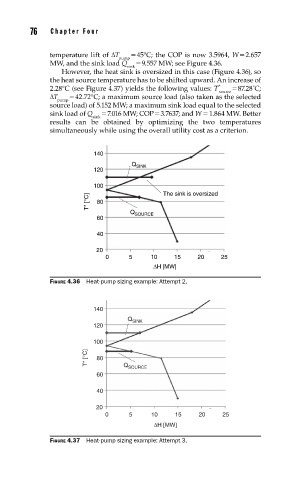
                     temperature lift of ΔT   = 45°C; the COP is now 3.5964, W = 2.657
                                        pump
                     MW, and the sink load Q   = 9.557 MW; see Figure 4.36.
                                          sink
                        However, the heat sink is oversized in this case (Figure 4.36), so
                     the heat source temperature has to be shifted upward. An increase of
                                                                   *    = 87.28˚C;
                     2.28°C (see Figure 4.37) yields the following values: T
                                                                   source
                     ΔT    = 42.72°C; a maximum source load (also taken as the selected
                       pump
                     source load) of 5.152 MW; a maximum sink load equal to the selected
                     sink load of Q   = 7.016 MW; COP = 3.7637; and W = 1.864 MW. Better
                                 sink
                     results can be obtained by optimizing the two temperatures
                     simultaneously while using the overall utility cost as a criterion.
                                 140
                                           Q SINK
                                 120

                                 100                The sink is oversized
                                T* [°C]  80

                                           Q SOURCE
                                  60

                                  40

                                  20
                                    0      5     10    15    20     25
                                                 ΔH [MW]

                     FIGURE 4.36  Heat-pump sizing example: Attempt 2.


                                 140
                                          Q SINK
                                 120

                                 100
                               T* [°C]  80
                                         Q
                                          SOURCE
                                  60
                                  40

                                  20
                                    0      5     10    15     20    25
                                                 ΔH [MW]

                     FIGURE 4.37  Heat-pump sizing example: Attempt 3.
   94   95   96   97   98   99   100   101   102   103   104