Page 98 - Sustainability in the Process Industry Integration and Optimization
P. 98

P r o c e s s I n t e g r a t i o n f o r I m p r ov i n g E n e r g y E f f i c i e n c y   75


                                            ΔT MIN  = 20°C
                       ΔH[MW]   T*[°C]
                        21.90    440            500
                                                450
                        29.40    410
                                                400
                        23.82    131            350
                        18.00    118            300
                                           T*[°C]  250
                         1.80    115
                                                200
                         0.00     94            150
                         4.30     91            100
                                                 50
                        11.50     79
                                                  0
                        15.00     30               0     10     20    30     40
                                                             ΔH [MW]

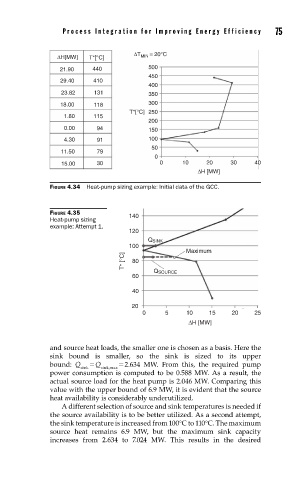
                     FIGURE 4.34  Heat-pump sizing example: Initial data of the GCC.


                     FIGURE 4.35           140
                     Heat-pump sizing
                     example: Attempt 1.
                                           120
                                                Q SINK
                                           100
                                                          Maximum
                                         T* [°C]  80
                                                 Q SOURCE
                                            60

                                            40
                                           20
                                              0      5    10    15     20    25
                                                           ΔH [MW]


                     and source heat loads, the smaller one is chosen as a basis. Here the
                     sink bound is smaller, so the sink is sized to its upper
                     bound:  Q   = Q     = 2.634 MW. From this, the required pump
                             sink  sink,max
                     power consumption is computed to be 0.588 MW. As a result, the
                     actual source load for the heat pump is 2.046 MW. Comparing this
                     value with the upper bound of 6.9 MW, it is evident that the source
                     heat availability is considerably underutilized.
                        A different selection of source and sink temperatures is needed if
                     the source availability is to be better utilized. As a second attempt,
                     the sink temperature is increased from 100°C to 110°C. The maximum
                     source heat remains 6.9 MW, but the maximum sink capacity
                     increases from 2.634 to 7.024 MW. This results in the desired
   93   94   95   96   97   98   99   100   101   102   103