
Page 308 - Sustainable Cities and Communities Design Handbook
P. 308
282 Sustainable Cities and Communities Design Handbook
and mentions the main challenges faced by the energy sector. The section The
Government’s Vision of Renewable Energies up to 2025 critically analyzes
the energy portfolio proposed by the government through 2025. The section
titled Options for a 100% Renewable Energy System by 2050 elaborates on
realistic options that Mauritius could exploit to achieve the 100% RE target by
2050. The chapter concludes by highlighting the prerequirements for the
successful implementation of this ambitious energy transition.
CURRENT ENERGY STATUS OF MAURITIUS
Primary Energy Requirements
Mauritius is located in the southwest of the Indian Ocean, off the eastern coast
of Madagascar. With a population of 1.2 million for a total surface area of
2
1865 km , Mauritius has one of the highest population densities in the world
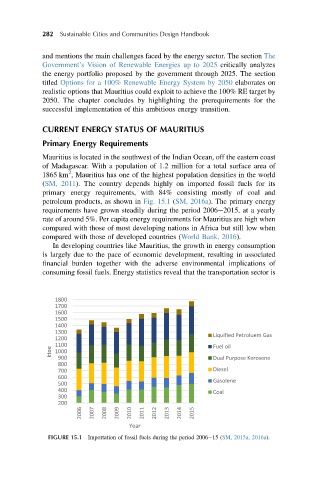
(SM, 2011). The country depends highly on imported fossil fuels for its
primary energy requirements, with 84% consisting mostly of coal and
petroleum products, as shown in Fig. 15.1 (SM, 2016a). The primary energy
requirements have grown steadily during the period 2006e2015, at a yearly
rate of around 5%. Per capita energy requirements for Mauritius are high when
compared with those of most developing nations in Africa but still low when
compared with those of developed countries (World Bank, 2016).
In developing countries like Mauritius, the growth in energy consumption
is largely due to the pace of economic development, resulting in associated
financial burden together with the adverse environmental implications of
consuming fossil fuels. Energy statistics reveal that the transportation sector is
1800
1700
1600
1500
1400
1300 Liquified Petroluem Gas
1200
1100 Fuel oil
ktoe 1000 Dual Purpose Kerosene
900
800
700 Diesel
600 Gasolene
500
400 Coal
300
200
2006 2007 2008 2009 2010 2011 2012 2013 2014 2015
Year
FIGURE 15.1 Importation of fossil fuels during the period 2006e15 (SM, 2015a, 2016a).