
Page 309 - Sustainable Cities and Communities Design Handbook
P. 309
Mauritius Island Nation Chapter j 15 283
by far the highest final energy consumer, accounting for 50.7% of the total
final energy consumption of the country, followed by manufacturing, house-
holds, commercial/distributive trade, and agriculture, which represented
23.7%, 14.2%, 10.5%, and 0.5% of the energy consumed, respectively (SM,
2016a). The higher standards of living ushered by economic growth of the
country have brought a considerable increase in the number of vehicles. The
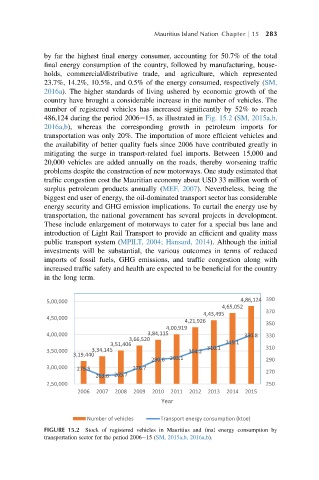
number of registered vehicles has increased significantly by 52% to reach
486,124 during the period 2006e15, as illustrated in Fig. 15.2 (SM, 2015a,b,
2016a,b), whereas the corresponding growth in petroleum imports for
transportation was only 20%. The importation of more efficient vehicles and
the availability of better quality fuels since 2006 have contributed greatly in
mitigating the surge in transport-related fuel imports. Between 15,000 and
20,000 vehicles are added annually on the roads, thereby worsening traffic
problems despite the construction of new motorways. One study estimated that
traffic congestion cost the Mauritian economy about USD 33 million worth of
surplus petroleum products annually (MEF, 2007). Nevertheless, being the
biggest end user of energy, the oil-dominated transport sector has considerable
energy security and GHG emission implications. To curtail the energy use by
transportation, the national government has several projects in development.
These include enlargement of motorways to cater for a special bus lane and
introduction of Light Rail Transport to provide an efficient and quality mass
public transport system (MPILT, 2004; Hansard, 2014). Although the initial
investments will be substantial, the various outcomes in terms of reduced
imports of fossil fuels, GHG emissions, and traffic congestion along with
increased traffic safety and health are expected to be beneficial for the country
in the long term.
5,00,000 4,86,124 390
4,65,052
370
4,43,495
4,50,000
4,21,926
350
4,00,919
4,00,000 3,84,115 330.8 330
3,66,520
3,51,406 319.1
3,50,000 3,34,145 304.2 310.1 310
3,19,440
290.6 293.1 290
3,00,000 275.5 276.7 270
263.6 265.7
2,50,000 250
2006 2007 2008 2009 2010 2011 2012 2013 2014 2015
Year
Number of vehicles Transport energy consump on (ktoe)
FIGURE 15.2 Stock of registered vehicles in Mauritius and final energy consumption by
transportation sector for the period 2006e15 (SM, 2015a,b, 2016a,b).