
Page 310 - Sustainable Cities and Communities Design Handbook
P. 310
284 Sustainable Cities and Communities Design Handbook
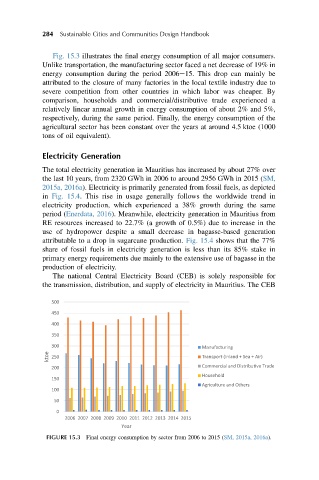
Fig. 15.3 illustrates the final energy consumption of all major consumers.
Unlike transportation, the manufacturing sector faced a net decrease of 19% in
energy consumption during the period 2006e15. This drop can mainly be
attributed to the closure of many factories in the local textile industry due to
severe competition from other countries in which labor was cheaper. By
comparison, households and commercial/distributive trade experienced a
relatively linear annual growth in energy consumption of about 2% and 5%,
respectively, during the same period. Finally, the energy consumption of the
agricultural sector has been constant over the years at around 4.5 ktoe (1000
tons of oil equivalent).
Electricity Generation
The total electricity generation in Mauritius has increased by about 27% over
the last 10 years, from 2320 GWh in 2006 to around 2956 GWh in 2015 (SM,
2015a, 2016a). Electricity is primarily generated from fossil fuels, as depicted
in Fig. 15.4. This rise in usage generally follows the worldwide trend in
electricity production, which experienced a 38% growth during the same
period (Enerdata, 2016). Meanwhile, electricity generation in Mauritius from
RE resources increased to 22.7% (a growth of 0.5%) due to increase in the
use of hydropower despite a small decrease in bagasse-based generation
attributable to a drop in sugarcane production. Fig. 15.4 shows that the 77%
share of fossil fuels in electricity generation is less than its 85% stake in
primary energy requirements due mainly to the extensive use of bagasse in the
production of electricity.
The national Central Electricity Board (CEB) is solely responsible for
the transmission, distribution, and supply of electricity in Mauritius. The CEB
500
450
400
350
300 Manufacturing
ktoe 250 Transport (Inland + Sea + Air)
200 Commercial and Distribu ve Trade
Household
150
Agriculture and Others
100
50
0
2006 2007 2008 2009 2010 2011 2012 2013 2014 2015
Year
FIGURE 15.3 Final energy consumption by sector from 2006 to 2015 (SM, 2015a, 2016a).