
Page 172 - Materials Chemistry, Second Edition
P. 172
Ch005-P373623.qxd 3/22/07 5:34 PM Page 151
Sustainability of Municipal Solid Waste Management
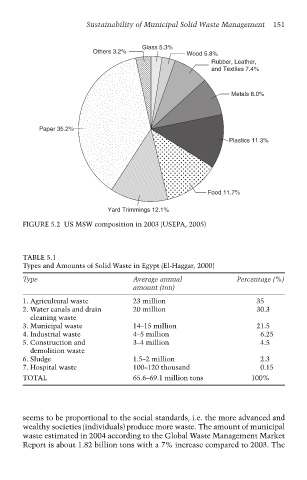
Glass 5.3% 151
Others 3.2% Wood 5.8%
Rubber, Leather,
and Textiles 7.4%
Metals 8.0%
Paper 35.2%
Plastics 11.3%
Food 11.7%
Yard Trimmings 12.1%
FIGURE 5.2 US MSW composition in 2003 (USEPA, 2005)
TABLE 5.1
Types and Amounts of Solid Waste in Egypt (El-Haggar, 2000)
Type Average annual Percentage (%)
amount (ton)
1. Agricultural waste 23 million 35
2. Water canals and drain 20 million 30.3
cleaning waste
3. Municipal waste 14–15 million 21.5
4. Industrial waste 4–5 million 6.25
5. Construction and 3–4 million 4.5
demolition waste
6. Sludge 1.5–2 million 2.3
7. Hospital waste 100–120 thousand 0.15
TOTAL 65.6–69.1 million tons 100%
seems to be proportional to the social standards, i.e. the more advanced and
wealthy societies (individuals) produce more waste. The amount of municipal
waste estimated in 2004 according to the Global Waste Management Market
Report is about 1.82 billion tons with a 7% increase compared to 2003. The