
Page 173 - Materials Chemistry, Second Edition
P. 173
Ch005-P373623.qxd 3/22/07 5:34 PM Page 152
Sustainable Industrial Design and Waste Management
152
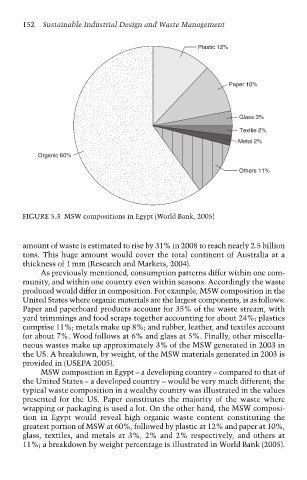
Plastic 12%
Paper 10%
Glass 3%
Textile 2%
Metal 2%
Organic 60%
Others 11%
FIGURE 5.3 MSW compositions in Egypt (World Bank, 2005)
amount of waste is estimated to rise by 31% in 2008 to reach nearly 2.5 billion
tons. This huge amount would cover the total continent of Australia at a
thickness of 1 mm (Research and Markets, 2004).
As previously mentioned, consumption patterns differ within one com-
munity, and within one country even within seasons. Accordingly the waste
produced would differ in composition. For example, MSW composition in the
United States where organic materials are the largest components, is as follows:
Paper and paperboard products account for 35% of the waste stream, with
yard trimmings and food scraps together accounting for about 24%; plastics
comprise 11%; metals make up 8%; and rubber, leather, and textiles account
for about 7%. Wood follows at 6% and glass at 5%. Finally, other miscella-
neous wastes make up approximately 3% of the MSW generated in 2003 in
the US. A breakdown, by weight, of the MSW materials generated in 2003 is
provided in (USEPA 2005).
MSW composition in Egypt – a developing country – compared to that of
the United States – a developed country – would be very much different; the
typical waste composition in a wealthy country was illustrated in the values
presented for the US. Paper constitutes the majority of the waste where
wrapping or packaging is used a lot. On the other hand, the MSW composi-
tion in Egypt would reveal high organic waste content constituting the
greatest portion of MSW at 60%, followed by plastic at 12% and paper at 10%,
glass, textiles, and metals at 3%, 2% and 2% respectively, and others at
11%; a breakdown by weight percentage is illustrated in World Bank (2005).