
Page 175 - Materials Chemistry, Second Edition
P. 175
Ch005-P373623.qxd 3/22/07 5:34 PM Page 154
Sustainable Industrial Design and Waste Management
154
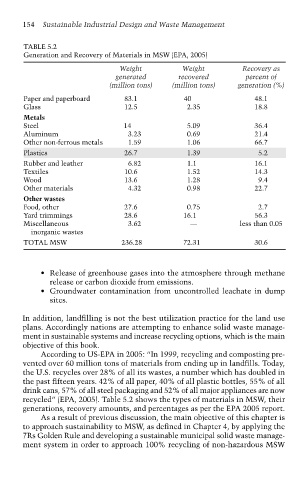
TABLE 5.2
Generation and Recovery of Materials in MSW (EPA, 2005)
Weight Weight Recovery as
generated recovered percent of
(million tons) (million tons) generation (%)
Paper and paperboard 83.1 40 48.1
Glass 12.5 2.35 18.8
Metals
Steel 14 5.09 36.4
Aluminum 3.23 0.69 21.4
Other non-ferrous metals 1.59 1.06 66.7
Plastics 26.7 1.39 5.2
Rubber and leather 6.82 1.1 16.1
Textiles 10.6 1.52 14.3
Wood 13.6 1.28 9.4
Other materials 4.32 0.98 22.7
Other wastes
Food, other 27.6 0.75 2.7
Yard trimmings 28.6 16.1 56.3
Miscellaneous 3.62 — less than 0.05
inorganic wastes
TOTAL MSW 236.28 72.31 30.6
• Release of greenhouse gases into the atmosphere through methane
release or carbon dioxide from emissions.
• Groundwater contamination from uncontrolled leachate in dump
sites.
In addition, landfilling is not the best utilization practice for the land use
plans. Accordingly nations are attempting to enhance solid waste manage-
ment in sustainable systems and increase recycling options, which is the main
objective of this book.
According to US-EPA in 2005: “In 1999, recycling and composting pre-
vented over 60 million tons of materials from ending up in landfills. Today,
the U.S. recycles over 28% of all its wastes, a number which has doubled in
the past fifteen years. 42% of all paper, 40% of all plastic bottles, 55% of all
drink cans, 57% of all steel packaging and 52% of all major appliances are now
recycled” (EPA, 2005). Table 5.2 shows the types of materials in MSW, their
generations, recovery amounts, and percentages as per the EPA 2005 report.
As a result of previous discussion, the main objective of this chapter is
to approach sustainability to MSW, as defined in Chapter 4, by applying the
7Rs Golden Rule and developing a sustainable municipal solid waste manage-
ment system in order to approach 100% recycling of non-hazardous MSW