
Page 342 -
P. 342
ChaPter 11 • Designing effeCtive outPut 309
COnsUlting OppORtUnity 11.4
Is Your Work a Grind?
“I want everything I can get my hands on, and the tighter the “This stuff looks terrible. It looks like scraps. My kinder-
information is packed, the better. Forget that stuff you hear about gartner makes better reports in crayon. Look at it. It’s all ground
information overload. It’s not in my vocabulary. I want it all, and up together. I can’t find anything. Where’s the summary of the
not in a bunch of pretty-looking, half-page reports either. I want number of beef items sold in each outlet? Where is the total
it all together, packed on one sheet that I can take into a meeting volume of items sold for all outlets? How about the information
in case I need to look something up. And I need it every week,” on our own shop downtown?” says Links, slicing at the report.
proclaims Stephen Links, vice president of a large, family-owned The report clearly needs to be redesigned. Design a report
sausage company. (or reports) that better suits Stephen Links. What approach can
During an interview, Links has been grilling Paul Plishka, who the analyst take in suggesting more reports with a less-crowded
is part of the systems analysis team that is busy designing an infor- format? Comment on the difficulty of implementing user sug-
mation system for Links Meats. Although Paul is hesitant about gestions that go against your design training. What are the trade-
what Links has told him, he proceeds to design a printed report that offs involved (as far as information overload goes) in generat-
includes all the important items the team has settled on during the ing numerous reports as opposed to generating one large report
analysis phase. containing all the information Stephen wants? Devise a heuristic
When a prototype of the new report, designed to his specifica- concerning the display of report information on one report in
tions, is handed to Stephen, however, there appears to be a change contrast to the generation of numerous reports. Consider advocat-
of heart. Links says in no uncertain terms that he can’t find what ing a Web-based or dashboard solution that would permit hyper-
he needs. links to all the information Stephen desires. How feasible is that?
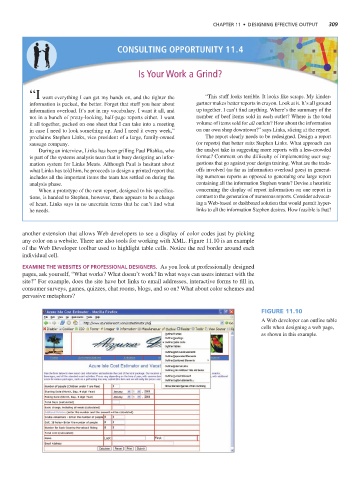
another extension that allows Web developers to see a display of color codes just by picking
any color on a website. There are also tools for working with XML. Figure 11.10 is an example
of the Web Developer toolbar used to highlight table cells. Notice the red border around each
individual cell.
exaMine The WebsiTes of professional designers. As you look at professionally designed
pages, ask yourself, “What works? What doesn’t work? In what ways can users interact with the
site?” For example, does the site have hot links to email addresses, interactive forms to fill in,
consumer surveys, games, quizzes, chat rooms, blogs, and so on? What about color schemes and
pervasive metaphors?
Figure 11.10
A Web developer can outline table
cells when designing a web page,
as shown in this example.