
Page 263 - The Combined Finite-Discrete Element Method
P. 263
246 TRANSITION FROM CONTINUA TO DISCONTINUA
(a) Mesh (b) Mesh
(c) Mesh (d) Mesh
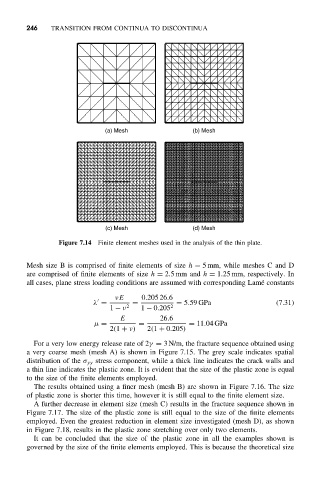
Figure 7.14 Finite element meshes used in the analysis of the thin plate.
Mesh size B is comprised of finite elements of size h = 5 mm, while meshes C and D
are comprised of finite elements of size h = 2.5mm and h = 1.25 mm, respectively. In
all cases, plane stress loading conditions are assumed with corresponding Lam´ e constants
νE 0.205 26.6
λ = = = 5.59 GPa (7.31)
1 − ν 2 1 − 0.205 2
E 26.6
µ = = = 11.04 GPa
2(1 + ν) 2(1 + 0.205)
For a very low energy release rate of 2γ = 3 N/m, the fracture sequence obtained using
a very coarse mesh (mesh A) is shown in Figure 7.15. The grey scale indicates spatial
distribution of the σ yy stress component, while a thick line indicates the crack walls and
a thin line indicates the plastic zone. It is evident that the size of the plastic zone is equal
to the size of the finite elements employed.
The results obtained using a finer mesh (mesh B) are shown in Figure 7.16. The size
of plastic zone is shorter this time, however it is still equal to the finite element size.
A further decrease in element size (mesh C) results in the fracture sequence shown in
Figure 7.17. The size of the plastic zone is still equal to the size of the finite elements
employed. Even the greatest reduction in element size investigated (mesh D), as shown
in Figure 7.18, results in the plastic zone stretching over only two elements.
It can be concluded that the size of the plastic zone in all the examples shown is
governed by the size of the finite elements employed. This is because the theoretical size