
Page 267 - The Combined Finite-Discrete Element Method
P. 267
250 TRANSITION FROM CONTINUA TO DISCONTINUA
(a) (b) (c)
(d) (e) (f)
(g) (h) (i)
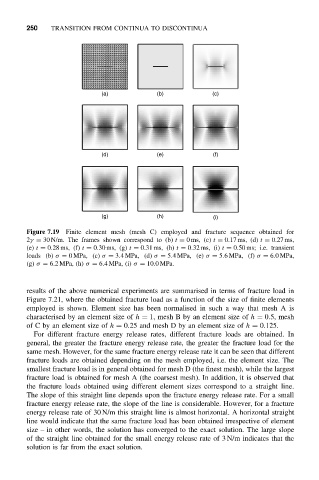
Figure 7.19 Finite element mesh (mesh C) employed and fracture sequence obtained for
2γ = 30 N/m. The frames shown correspond to (b) t = 0ms, (c) t = 0.17 ms, (d) t = 0.27 ms,
(e) t = 0.28 ms, (f) t = 0.30 ms, (g) t = 0.31 ms, (h) t = 0.32 ms, (i) t = 0.50 ms; i.e. transient
loads (b) σ = 0MPa, (c) σ = 3.4MPa, (d) σ = 5.4MPa, (e) σ = 5.6 MPa, (f) σ = 6.0MPa,
(g) σ = 6.2MPa, (h) σ = 6.4MPa, (i) σ = 10.0MPa.
results of the above numerical experiments are summarised in terms of fracture load in
Figure 7.21, where the obtained fracture load as a function of the size of finite elements
employed is shown. Element size has been normalised in such a way that mesh A is
characterised by an element size of h = 1, mesh B by an element size of h = 0.5, mesh
of C by an element size of h = 0.25 and mesh D by an element size of h = 0.125.
For different fracture energy release rates, different fracture loads are obtained. In
general, the greater the fracture energy release rate, the greater the fracture load for the
same mesh. However, for the same fracture energy release rate it can be seen that different
fracture loads are obtained depending on the mesh employed, i.e. the element size. The
smallest fracture load is in general obtained for mesh D (the finest mesh), while the largest
fracture load is obtained for mesh A (the coarsest mesh). In addition, it is observed that
the fracture loads obtained using different element sizes correspond to a straight line.
The slope of this straight line depends upon the fracture energy release rate. For a small
fracture energy release rate, the slope of the line is considerable. However, for a fracture
energy release rate of 30 N/m this straight line is almost horizontal. A horizontal straight
line would indicate that the same fracture load has been obtained irrespective of element
size – in other words, the solution has converged to the exact solution. The large slope
of the straight line obtained for the small energy release rate of 3 N/m indicates that the
solution is far from the exact solution.