
Page 59 -
P. 59
The Practical Pumping Handbook ....................................... ~ .............................
System /
System
Curve
Q Q
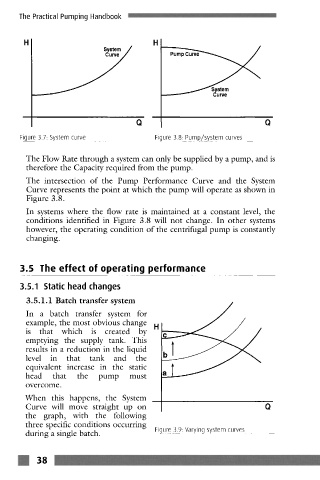
Figure 3.7: System curve Figure 3.8 Pump/system curves
The Flow Rate through a system can only be supplied by a pump, and is
therefore the Capacity required from the pump.
The intersection of the Pump Performance Curve and the System
Curve represents the point at which the pump will operate as shown in
Figure 3.8.
In systems where the flow rate is maintained at a constant level, the
conditions identified in Figure 3.8 will not change. In other systems
however, the operating condition of the centrifugal pump is constantly
changing.
3.5 lhe effect of operating performance
3.5.1 Static head changes
3.5.1.1 Batch transfer system
In a batch transfer system for
example, the most obvious change
is that which is created by
emptying the supply tank. This
results in a reduction in the liquid
level in that tank and the
equivalent increase in the static
head that the pump must
ovcrcomc.
When this happcns, the System
Curve will move straight up on Q
the graph, with the following
three specific conditions occurring Figure 3.9. Varying system curves
during a single batch.
m 38