
Page 198 - The Six Sigma Project Planner
P. 198
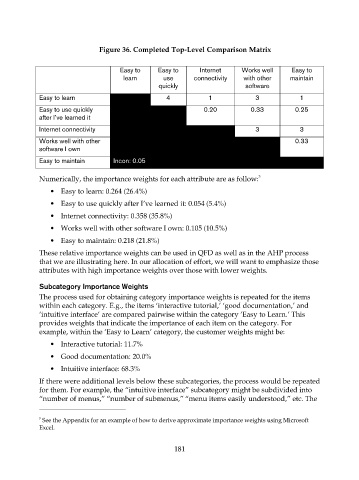
Figure 36. Completed Top-Level Comparison Matrix


                                            Easy to     Easy to     Internet     Works well     Easy to
                                             learn       use      connectivity   with other    maintain
                                                        quickly                   software
                    Easy to learn                         4            1             3            1

                    Easy to use quickly                              0.20           0.33         0.25
                    after I’ve learned it
                    Internet connectivity                                            3            3

                    Works well with other                                                        0.33
                    software I own
                    Easy to maintain      Incon: 0.05

                                                                                      3
                    Numerically, the importance weights for each attribute are as follow:
                       •  Easy to learn: 0.264 (26.4%)
                       •  Easy to use quickly after I’ve learned it: 0.054 (5.4%)
                       •  Internet connectivity: 0.358 (35.8%)

                       •  Works well with other software I own: 0.105 (10.5%)
                       •  Easy to maintain: 0.218 (21.8%)
                    These relative importance weights can be used in QFD as well as in the AHP process
                    that we are illustrating here. In our allocation of effort, we will want to emphasize those
                    attributes with high importance weights over those with lower weights.

                    Subcategory Importance Weights
                    The process used for obtaining category importance weights is repeated for the items
                    within each category. E.g., the items ‘interactive tutorial,’ ‘good documentation,’ and
                    ‘intuitive interface’ are compared pairwise within the category ‘Easy to Learn.’ This
                    provides weights that indicate the importance of each item on the category. For
                    example, within the ‘Easy to Learn’ category, the customer weights might be:

                       •  Interactive tutorial: 11.7%
                       •  Good documentation: 20.0%
                       •  Intuitive interface: 68.3%
                    If there were additional levels below these subcategories, the process would be repeated
                    for them. For example, the “intuitive interface” subcategory might be subdivided into
                    “number of menus,” “number of submenus,” “menu items easily understood,” etc. The

                    3
                     See the Appendix for an example of how to derive approximate importance weights using Microsoft
                    Excel.

                                                             181