
Page 203 - The Six Sigma Project Planner
P. 203
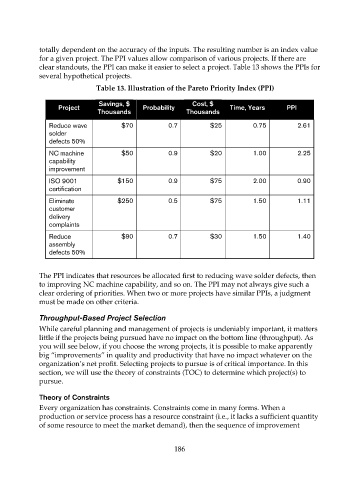
totally dependent on the accuracy of the inputs. The resulting number is an index value
                    for a given project. The PPI values allow comparison of various projects. If there are
                    clear standouts, the PPI can make it easier to select a project. Table 13 shows the PPIs for
                    several hypothetical projects.

                                     Table 13. Illustration of the Pareto Priority Index (PPI)
                                      Savings, $                  Cost, $
                          Project                  Probability               Time, Years      PPI
                                      Thousands                 Thousands

                       Reduce wave           $70           0.7         $25          0.75          2.61
                       solder
                       defects 50%
                       NC machine            $50           0.9         $20          1.00          2.25
                       capability
                       improvement
                       ISO 9001            $150            0.9         $75          2.00          0.90
                       certification

                       Eliminate           $250            0.5         $75          1.50          1.11
                       customer
                       delivery
                       complaints
                       Reduce                $90           0.7         $30          1.50          1.40
                       assembly
                       defects 50%


                    The PPI indicates that resources be allocated first to reducing wave solder defects, then
                    to improving NC machine capability, and so on. The PPI may not always give such a
                    clear ordering of priorities. When two or more projects have similar PPIs, a judgment
                    must be made on other criteria.

                    Throughput-Based Project Selection
                    While careful planning and management of projects is undeniably important, it matters
                    little if the projects being pursued have no impact on the bottom line (throughput). As
                    you will see below, if you choose the wrong projects, it is possible to make apparently
                    big “improvements” in quality and productivity that have no impact whatever on the
                    organization’s net profit. Selecting projects to pursue is of critical importance. In this
                    section, we will use the theory of constraints (TOC) to determine which project(s) to
                    pursue.


                    Theory of Constraints
                    Every organization has constraints. Constraints come in many forms. When a
                    production or service process has a resource constraint (i.e., it lacks a sufficient quantity
                    of some resource to meet the market demand), then the sequence of improvement


                                                             186