
Page 202 - The Six Sigma Project Planner
P. 202
treated rather than their underlying “diseases.” For example, if quality problems cause
schedule slippages that lead to customer complaints, the “solution” might be to keep a
large inventory and sort the good from the bad. The result is that the schedule is met
and customers stop complaining, but at huge cost. These opportunities are often greater
than those currently causing “pain,” but they are now built into business systems and
therefore very difficult to see. One solution to the hidden problem phenomenon is to
focus on processes rather than symptoms. Some guidelines for identifying
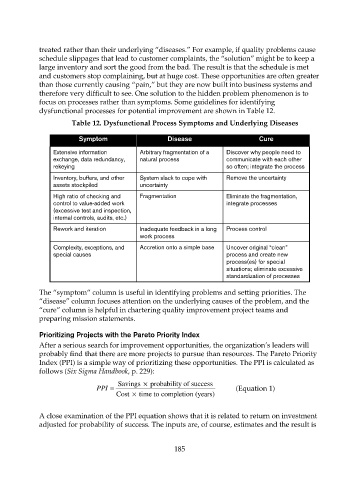
dysfunctional processes for potential improvement are shown in Table 12.
Table 12. Dysfunctional Process Symptoms and Underlying Diseases
Symptom Disease Cure
Extensive information Arbitrary fragmentation of a Discover why people need to
exchange, data redundancy, natural process communicate with each other
rekeying so often; integrate the process
Inventory, buffers, and other System slack to cope with Remove the uncertainty
assets stockpiled uncertainty
High ratio of checking and Fragmentation Eliminate the fragmentation,
control to value-added work integrate processes
(excessive test and inspection,
internal controls, audits, etc.)
Rework and iteration Inadequate feedback in a long Process control
work process
Complexity, exceptions, and Accretion onto a simple base Uncover original “clean”
special causes process and create new
process(es) for special
situations; eliminate excessive
standardization of processes
The “symptom” column is useful in identifying problems and setting priorities. The
“disease” column focuses attention on the underlying causes of the problem, and the
“cure” column is helpful in chartering quality improvement project teams and
preparing mission statements.
Prioritizing Projects with the Pareto Priority Index
After a serious search for improvement opportunities, the organization’s leaders will
probably find that there are more projects to pursue than resources. The Pareto Priority
Index (PPI) is a simple way of prioritizing these opportunities. The PPI is calculated as
follows (Six Sigma Handbook, p. 229):
×
PPI = Savings probability of success (Equation 1)
×
Cost time to completion (years)
A close examination of the PPI equation shows that it is related to return on investment
adjusted for probability of success. The inputs are, of course, estimates and the result is
185