
Page 420 - The Mechatronics Handbook
P. 420
0066_frame_C19 Page 42 Wednesday, January 9, 2002 5:17 PM
The applicable range for this type of transducer is a function of the cross-sectional area of the core.
The accuracy of the device is determined by a calibration process. This transducer has poor linearity and
is subject to hysteresis. The permeability of a magnetostrictive material increases when it is subject to
pure torsion, regardless of direction. A flat frequency response is obtained over a wide range from 150
to 15,000 Hz.
Piezotransistor Method
Devices that utilize anisotropic stress effects are described as piezotransistors. In this effect, if the upper
surface of a p-n diode is subjected to a localized stress, a significant reversible change occurs in the current
across the junction. These transistors are usually silicon nonplanar type, with an emitter base junction.
This junction is mechanically connected to a diaphragm positioned on the upper surface of a typical
TO-type can [4]. When a pressure or a force is applied to the diaphragm, an electronic charge is produced.
It is advisable to use these force-measuring devices at a constant temperature by virtue of the fact that
semiconducting materials also change their electric properties with temperature variations. The attractive
characteristic of piezotransistors is that they can withstand a 500% overload.
Multicomponent Dynamometers Using Quartz Crystals as Sensing Elements
The Piezoelectric Effects in Quartz
For force measurements, the direct piezoelectric effect is utilized. The direct longitudinal effect measures
compressive force; the direct shear effect measures shear force in one direction. For example, if a disk of
crystalline quartz (SiO 2 ) cut normally to the crystallographic x-axis is loaded by a compression force, it
will yield an electric charge, nominally 2.26 pC/N. If a disk of crystalline quartz is cut normally to the
crystallographic y-axis, it will yield an electric charge (4.52 pC/N) if loaded by a shear force in one specific
direction. Forces applied in the other directions will not generate any output [5].
A charge amplifier is used to convert the charge yielded by a quartz crystal element into a proportional
voltage. The range of a charge amplifier with respect to its conversion factor is determined by a feedback
capacitor. Adjustment to mechanical units is obtained by additional operational amplifiers with variable gain.
The Design of Quartz Multicomponent Dynamometers
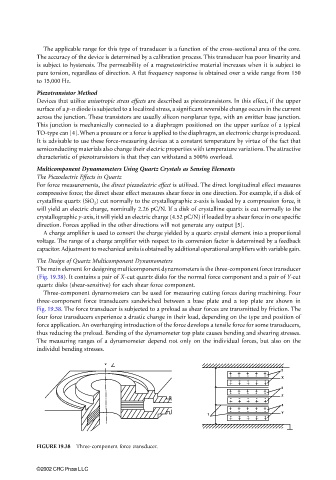
The main element for designing multicomponent dynamometers is the three-component force transducer
(Fig. 19.38). It contains a pair of X-cut quartz disks for the normal force component and a pair of Y-cut
quartz disks (shear-sensitive) for each shear force component.
Three-component dynamometers can be used for measuring cutting forces during machining. Four
three-component force transducers sandwiched between a base plate and a top plate are shown in
Fig. 19.38. The force transducer is subjected to a preload as shear forces are transmitted by friction. The
four force transducers experience a drastic change in their load, depending on the type and position of
force application. An overhanging introduction of the force develops a tensile force for some transducers,
thus reducing the preload. Bending of the dynamometer top plate causes bending and shearing stresses.
The measuring ranges of a dynamometer depend not only on the individual forces, but also on the
individul bending stresses.
v
2
+ + + + +
- - - - - - - - - - X
+
+
+
+
+
3
+ + + + +
- - - - - - - - - - Z
+
+
+
4
+
+
+ + + + +
- - - - -
1 - + - + - + - + - + Y
FIGURE 19.38 Three-component force transducer.
©2002 CRC Press LLC