
Page 91 - Thermodynamics of Biochemical Reactions
P. 91
86 Chapter 4 Thermodynamics of Biochemical Reactions at Specified pH
-34
-36
-3 8
-40
-42
-44
I....'........., PH
.'
6 7 8 9
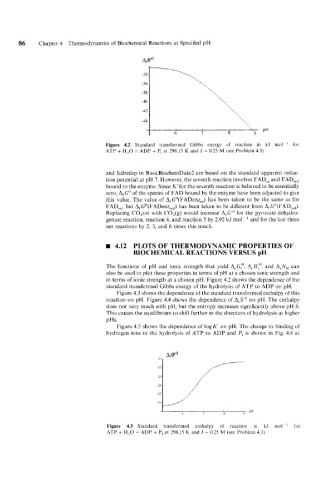
Figure 4.2 Standard transformed Gibbs energy of reaction in kJ mol-' for
ATP + H,O = ADP + P, at 298.15 K and I = 0.25 M (see Problem 4.3).
and fadredsp in BasicBiochemData2 are based on the standard apparent reduc-
tion potential at pH 7. However, the seventh reaction involves FAD,, and FAD,,,
bound to the enzyme. Since K' for the seventh reaction is believed to be essentially
zero, A,Go of the species of FAD bound by the enzyme have been adjusted to give
this value. The value of A,Go(FADenz,,) has been taken to be the same as for
FAD,,, but Af Go(FADenz,,,) has been taken to be different from Af Go(FADr,,).
Replacing C0,tot with CO,(g) would increase A,G" for the pyruvate dehydro-
genase reaction. reaction 4, and reaction 5 by 2.92 kJ mol~ and for the last three
net reactions by 2, 3, and 6 times this much.
4.12 PLOTS OF THERMODYNAMIC PROPERTIES OF
BIOCHEMICAL REACTIONS VERSUS pH
The functions of pH and ionic strength that yield A,Gio, A,HIo, and ArNH can
also be used to plot these properties in terms of pH at a chosen ionic strength and
in terms of ionic strength at a chosen pH. Figure 4.2 shows the dependence of the
standard transformed Gibbs energy of the hydrolysis of ATP to ADP on pH.
Figure 4.3 shows the dependence of the standard transformed enthalpy of this
reaction on pH. Figure 4.4 shows the dependence of A$'' on pH. The enthalpy
does not vary much with pH, but the entropy increases significantly above pH 6.
This causes the equilibrium to shift further in the direction of hydrolysis at higher
pHs.
Figure 4.5 shows the dependence of log K' on pH. The change in binding of
hydrogen ions in the hydrolysis of ATP to ADP and Pi is shown in Fig. 4.6 at
Figure 4.3 Standard transformed enthalpy of reaction in kJ mol for
ATP + H,O = ADP + P, at 298.15 K and I = 0.25 M (see Problem 4.3).