
Page 86 - Thermodynamics of Biochemical Reactions
P. 86
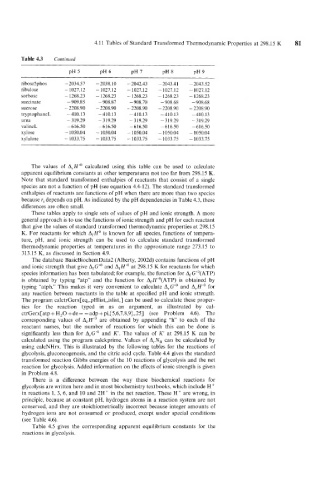
4.11 Tables of  Standard Transformed  Thermodynamic Properties  at 298.15 K   81


         Table 4.3   Continued


         ribose5phos     - 2034.57   - 2038.10   - 2042.43   - 2043.41   -2043.52
         ribulose        - 1027.12   - 1027.12   - 1027.12   - 1027.12   - 1027.12
         sorbose         - 1268.23   - 1268.23   - 1268.23   - 1268.23   - 1268.23
         succinate       - 909.85    - 908.87   -908.70    - 908.68   -908.68
         sucrose         - 2208.90   - 2208.90   - 2208.90   - 2208.90   - 2208.90
         tryptophaneL    -410.13     -410.13    - 410.13   - 410.13   - 410.13
         urea            - 319.29    - 3 19.29   -319.29   - 319.29   - 319.29
         valineL         - 616.50    -616.50    - 616.50   -616.50    -616.50
         xylose          - 1050.04   - 1050.04   - 1050.04   - 1050.04   - 1050.04
         x ylulose       - 1033.75   - 1033.75   - 1033.75   - 1033.75   - 1033.75


             The  values  of  A,H”  calculated  using  this  table  can  be  used  to  calculate
         apparent equilibrium constants at other temperatures  not too far from 298.15 K.
         Note that  standard  transformed  enthalpies  of  reactants  that  consist  of  a  single
         species are not a function of pH (see equation 4.4-12). The standard transformed
         enthalpies of  reactants are functions of pH when there are more than two species
         because r, depends on pH. As indicated by the pH dependencies in Table 4.3, these
         differences are often small.
             These tables apply to single sets of  values of  pH and ionic strength. A  more
         general approach is to use the functions of ionic strength and pH for each reactant
         that give the values of standard transformed thermodynamic  properties  at 298.15
         K. For reactants  for which  A,H’  is known  for  all species, functions of  tempera-
         ture,  pH,  and  ionic  strength  can  be  used  to  calculate  standard  transformed
         thermodynamic  properties  at temperatures  in  the  approximate range  273.15  to
         313.15 K, as discussed  in Section 4.9.
             The database BasicBiochemData2  (Alberty, 2002d) contains functions of pH
         and ionic strength that give A,G“  and A,H“  at 298.15 K for reactants for which
         species information has been tabulated; for example, the function for Af G”(ATP)
         is  obtained  by  typing  “atp” and  the  function  for  A,H”(ATP)  is  obtained  by
         typing  “atph.” This makes  it  very  convenient  to calculate  A,G”  and  A,H”  for
         any reaction  between  reactants  in  the  table  at specified pH  and  ionic  strength.
         The program calctrGerx[eq-,pHlist-,islist-]  can be used to calculate these proper-
         ties  for  the  reaction  typed  in  as  an  argument,  as  illustrated  by  cal-
         ctrGerx[atp + H,O  +de = = adp + pi,{5,6,7,8,9},.25]  (see  Problem  4.6).  The
         corresponding  values  of  A,H“  are  obtained by  appending  “h to  each  of  the
         reactant  names,  but  the  number  of  reactions  for  which  this  can  be  done  is
         significantly  less  than  for  Arc” and  K‘. The values  of  K’ at  298.15 K  can be
         calculated  using  the program calckprime.  Values  of  ArN,  can be  calculated  by
         using  calcNHrx.  This  is  illustrated  by  the following tables  for  the  reactions  of
         glycolysis, gluconeogenesis,  and the citric acid cycle. Table 4.4 gives the standard
         transformed reaction Gibbs energies of the  10 reactions of glycolysis and the net
         reaction for glycolysis. Added information  on the effects of ionic strength is given
         in Problem  4.8.
             There  is  a  difference  between  the  way  these  biochemical  reactions  for
         glycolysis are written here and in most biochemistry textbooks, which include H+
         in reactions  1, 3, 6, and  10 and 2H’  in the net  reaction. These H+ are wrong, in
         principle, because at constant pH, hydrogen  atoms in a reaction  system  are not
         conserved, and they  are stoichiometrically  incorrect  because  integer  amounts of
         hydrogen  ions  are not  consumed  or produced,  except  under  special  conditions
         (see Table 4.6).
             Table  4.5  gives  the  corresponding  apparent  equilibrium  constants  for  the
         reactions in glycolysis.