
Page 50 - Using ANSYS for Finite Element Analysis Dynamic, Probabilistic, Design and Heat Transfer Analysis
P. 50
composite materials • 37
--- ----- ---------- ---
1 45.0 0.250 1
2 -45.0 0.250 2
3 -45.0 0.250 2
4 45.0 0.250 1
------------------------
SUM OF THK 1.00
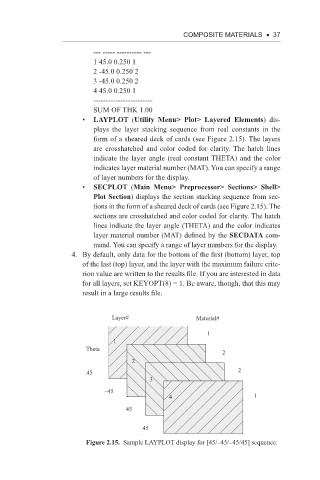
• LAYPLOT (Utility Menu> Plot> Layered Elements) dis-
plays the layer stacking sequence from real constants in the
form of a sheared deck of cards (see Figure 2.15). The layers
are crosshatched and color coded for clarity. The hatch lines
indicate the layer angle (real constant THETA) and the color
indicates layer material number (MAT). You can specify a range
of layer numbers for the display.
• SECPLOT (Main Menu> Preprocessor> Sections> Shell>
Plot Section) displays the section stacking sequence from sec-
tions in the form of a sheared deck of cards (see Figure 2.15). The
sections are crosshatched and color coded for clarity. The hatch
lines indicate the layer angle (THETA) and the color indicates
layer material number (MAT) defined by the SECDATA com-
mand. You can specify a range of layer numbers for the display.
4. By default, only data for the bottom of the first (bottom) layer, top
of the last (top) layer, and the layer with the maximum failure crite-
rion value are written to the results file. If you are interested in data
for all layers, set KEYOPT(8) = 1. Be aware, though, that this may
result in a large results file.
Layer# Material#
1
1
Theta
2
2
45 2
3
–45
4 1
–45
45
Figure 2.15. Sample LAYPLOT display for [45/−45/−45/45] sequence.