
Page 49 - Using ANSYS for Finite Element Analysis Dynamic, Probabilistic, Design and Heat Transfer Analysis
P. 49
36 • using ansys for finite eLement anaLysis
• EPLOT (Utility Menu> Plot> Elements) displays all selected
elements. Using the /ESHAPE,1 command (Utility Menu>
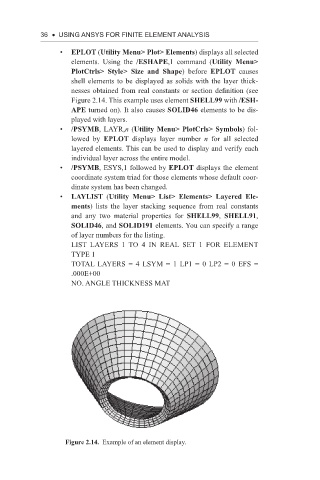
PlotCtrls> Style> Size and Shape) before EPLOT causes
shell elements to be displayed as solids with the layer thick-
nesses obtained from real constants or section definition (see
Figure 2.14. This example uses element SHELL99 with /ESH-
APE turned on). It also causes SOLID46 elements to be dis-
played with layers.
• /PSYMB, LAYR,n (Utility Menu> PlotCrls> Symbols) fol-
lowed by EPLOT displays layer number n for all selected
layered elements. This can be used to display and verify each
individual layer across the entire model.
• /PSYMB, ESYS,1 followed by EPLOT displays the element
coordinate system triad for those elements whose default coor-
dinate system has been changed.
• LAYLIST (Utility Menu> List> Elements> Layered Ele-
ments) lists the layer stacking sequence from real constants
and any two material properties for SHELL99, SHELL91,
SOLID46, and SOLID191 elements. You can specify a range
of layer numbers for the listing.
LIST LAYERS 1 TO 4 IN REAL SET 1 FOR ELEMENT
TYPE 1
TOTAL LAYERS = 4 LSYM = 1 LP1 = 0 LP2 = 0 EFS =
.000E+00
NO. ANGLE THICKNESS MAT
Figure 2.14. Example of an element display.