
Page 68 - Vibrational Spectroscopic Imaging for Biomedical Applications
P. 68
44 Cha pte r T w o
0.6
0.4
Absorbance 0.2
0.0
–0.2
4000 3500 3000 2500 2000 1500 1000
–1
Wavenumber (cm )
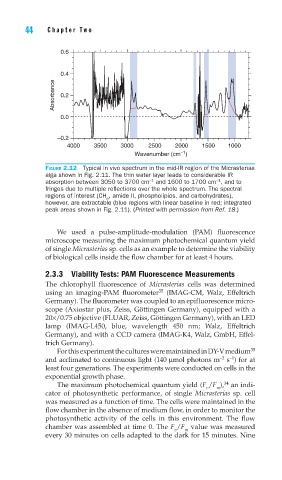
FIGURE 2.12 Typical in vivo spectrum in the mid-IR region of the Micrasterias
alga shown in Fig. 2.11. The thin water layer leads to considerable IR
–1
–1
absorption between 3050 to 3700 cm and 1600 to 1700 cm , and to
fringes due to multiple refl ections over the whole spectrum. The spectral
regions of interest (CH , amide II, phospholipids, and carbohydrates),
n
however, are extractable (blue regions with linear baseline in red; integrated
peak areas shown in Fig. 2.11). (Printed with permission from Ref. 18.)
We used a pulse-amplitude-modulation (PAM) fluorescence
microscope measuring the maximum photochemical quantum yield
of single Micrasterias sp. cells as an example to determine the viability
of biological cells inside the flow chamber for at least 4 hours.
2.3.3 Viability Tests: PAM Fluorescence Measurements
The chlorophyll fluorescence of Micrasterias cells was determined
35
using an imaging-PAM fluorometer (IMAG-CM, Walz, Effeltrich
Germany). The fluorometer was coupled to an epifluorescence micro-
scope (Axiostar plus, Zeiss, Göttingen Germany), equipped with a
20×/0.75 objective (FLUAR, Zeiss, Göttingen Germany), with an LED
lamp (IMAG-L450, blue, wavelength 450 nm; Walz, Effeltrich
Germany), and with a CCD camera (IMAG-K4, Walz, GmbH, Effel-
trich Germany).
For this experiment the cultures were maintained in DY-V medium 35
–2
–1
and acclimated to continuous light (140 μmol photons m s ) for at
least four generations. The experiments were conducted on cells in the
exponential growth phase.
34
The maximum photochemical quantum yield (F /F ), an indi-
v m
cator of photosynthetic performance, of single Micrasterias sp. cell
was measured as a function of time. The cells were maintained in the
flow chamber in the absence of medium flow, in order to monitor the
photosynthetic activity of the cells in this environment. The flow
chamber was assembled at time 0. The F /F value was measured
v m
every 30 minutes on cells adapted to the dark for 15 minutes. Nine