
Page 69 - Vibrational Spectroscopic Imaging for Biomedical Applications
P. 69
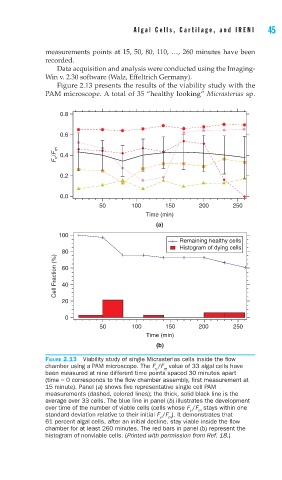
Algal Cells, Cartilage, and IRENI    45


        measurements points at 15, 50, 80, 110, …, 260 minutes have been
        recorded.
            Data acquisition and analysis were conducted using the Imaging-
        Win v. 2.30 software (Walz, Effeltrich Germany).
            Figure 2.13 presents the results of the viability study with the
        PAM microscope. A total of 35 “healthy looking” Micrasterias sp.


            0.8

            0.6

           F v /F m  0.4


            0.2


            0.0
                       50       100      150       200      250
                                    Time (min)
                                       (a)
            100
                                             Remaining healthy cells
                                             Histogram of dying cells
             80
           Cell Fraction (%)  60


             40

             20
              0
                       50       100      150       200      250
                                    Time (min)
                                       (b)

        FIGURE 2.13  Viability study of single Micrasterias cells inside the fl ow
        chamber using a PAM microscope. The F /F  value of 33 algal cells have
                                       v  m
        been measured at nine different time points spaced 30 minutes apart
        (time = 0 corresponds to the fl ow chamber assembly, fi rst measurement at
        15 minute). Panel (a) shows fi ve representative single cell PAM
        measurements (dashed, colored lines); the thick, solid black line is the
        average over 33 cells. The blue line in panel (b) illustrates the development
        over time of the number of viable cells (cells whose F /F  stays within one
                                                v  m
        standard deviation relative to their initial F /F ). It demonstrates that
                                        v  m
        61 percent algal cells, after an initial decline, stay viable inside the fl ow
        chamber for at least 260 minutes. The red bars in panel (b) represent the
        histogram of nonviable cells. (Printed with permission from Ref. 18.)