
Page 66 - Vibrational Spectroscopic Imaging for Biomedical Applications
P. 66
42 Cha pte r T w o
2.3.2 Mid-IR and Vis Measurements
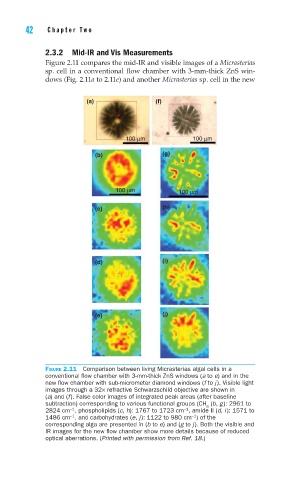
Figure 2.11 compares the mid-IR and visible images of a Micrasterias
sp. cell in a conventional flow chamber with 3-mm-thick ZnS win-
dows (Fig. 2.11a to 2.11e) and another Micrasterias sp. cell in the new
(a) (f)
100 μm 100 μm
(b) (g)
100 μm 100 μm
(c) (h)
(d) (i)
(e) (j)
FIGURE 2.11 Comparison between living Micrasterias algal cells in a
conventional fl ow chamber with 3-mm-thick ZnS windows (a to e) and in the
new fl ow chamber with sub-micrometer diamond windows (f to j). Visible light
images through a 32× refractive Schwarzschild objective are shown in
(a) and (f). False color images of integrated peak areas (after baseline
subtraction) corresponding to various functional groups (CH (b, g): 2961 to
n
–1
–1
2824 cm , phospholipids (c, h): 1767 to 1723 cm , amide II (d, i): 1571 to
–1
–1
1486 cm , and carbohydrates (e, j): 1122 to 980 cm ) of the
corresponding alga are presented in (b to e) and (g to j). Both the visible and
IR images for the new fl ow chamber show more details because of reduced
optical aberrations. (Printed with permission from Ref. 18.)